Quantity of
output (# of
cookies
per hour)
Total product
curve
Quantity of input
(# of workers)
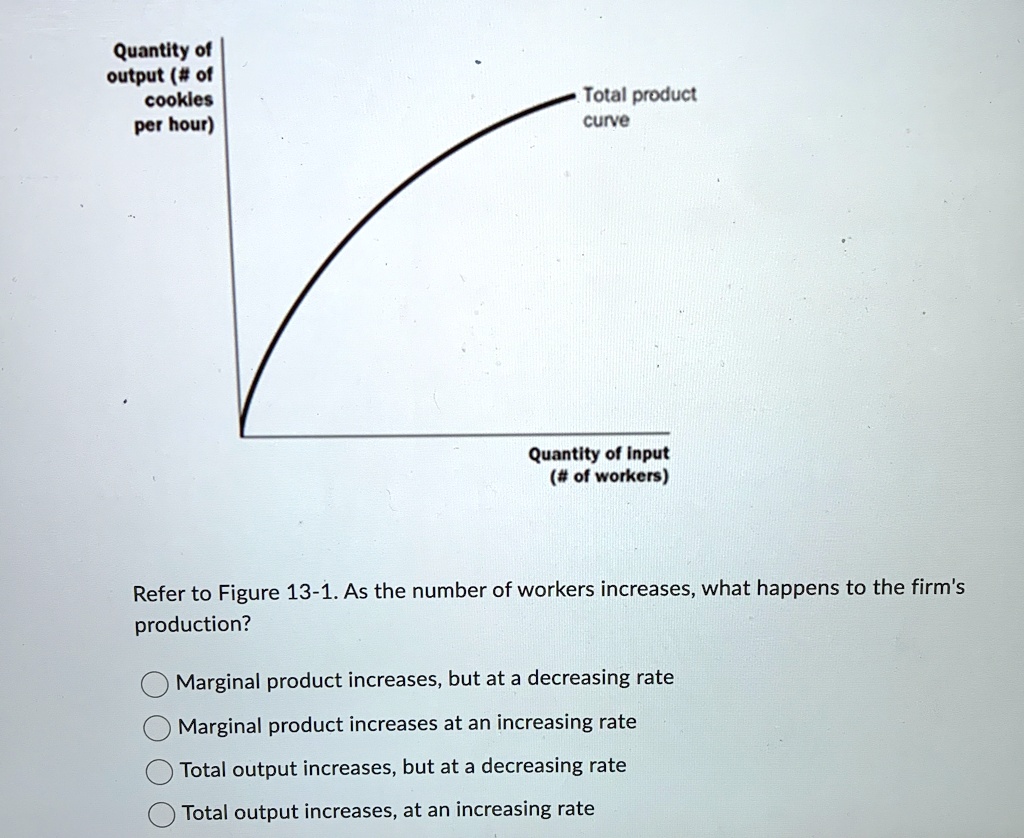
Refer to Figure 13-1. As the number of workers increases, what happens to the firm's
production?
Marginal product increases, but at a decreasing rate
Marginal product increases at an increasing rate
Total output increases, but at a decreasing rate
Total output increases, at an increasing rate