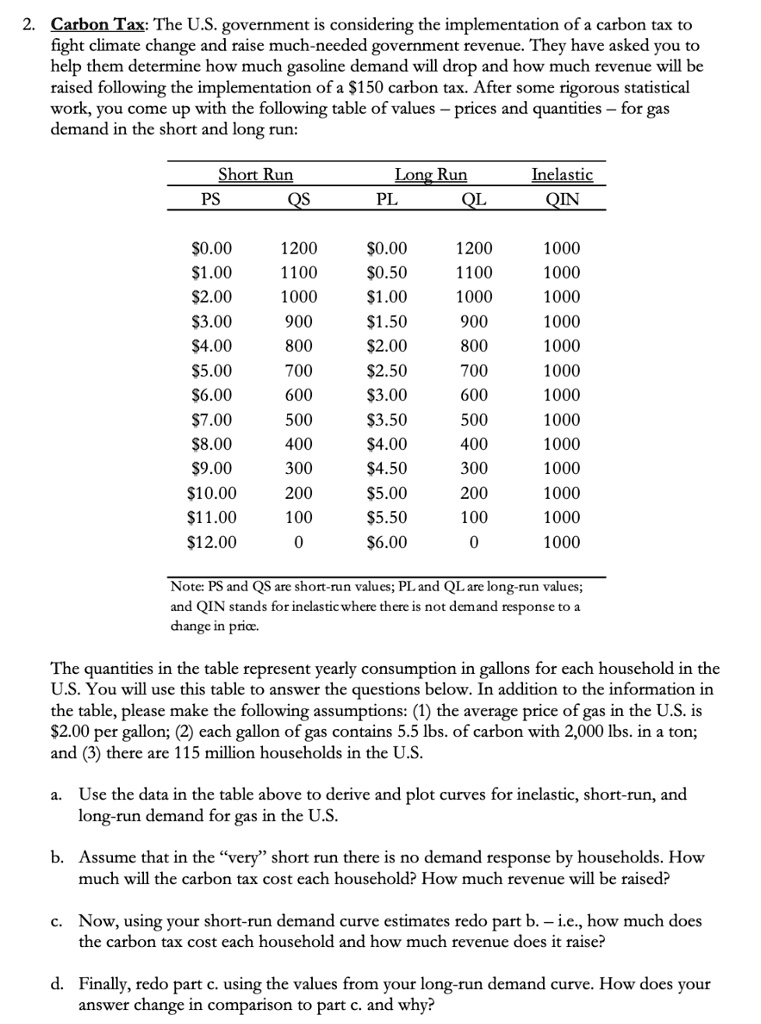
Carbon Tax: The U.S. government is considering the implementation of a carbon tax to fight climate change and raise much-needed government revenue. They have asked you to help them determine how much gasoline demand will drop and how much revenue will be raised following the implementation of a $150 carbon tax. After some rigorous statistical work, you come up with the following table of values, prices, and quantities for gas demand in the short and long run:
Short Run:
PS QS
$0.00 1200
$1.00 1100
$2.00 1000
$3.00 900
$4.00 800
$5.00 700
$6.00 600
$7.00 500
$8.00 400
$9.00 300
$10.00 200
$11.00 100
Long Run:
PL QL
$0.00 1200
$0.50 1100
$1.00 1000
$1.50 900
$2.00 800
$2.50 700
$3.00 600
$3.50 500
$4.00 400
$4.50 300
$5.00 200
$5.50 100
Inelastic:
QIN
1000
1000
1000
1000
1000
1000
1000
1000
1000
1000
1000
1000
1000
Note: PS and QS are short-run values; PL and QL are long-run values; and QIN stands for inelastic where there is no demand response to change in price.
The quantities in the table represent yearly consumption in gallons for each household in the US. You will use this table to answer the questions below. In addition to the information in the table, please make the following assumptions: (1) the average price of gas in the U.S. is $2.00 per gallon; each gallon of gas contains 5.5 lbs. of carbon with 2,000 lbs. in a ton; and there are 115 million households in the U.S.
Use the data in the table above to derive and plot curves for inelastic, short-run, and long-run demand for gas in the U.S.
Assume that in the very short run there is no demand response by households. How much will the carbon tax cost each household? How much revenue will be raised?
Now, using your short-run demand curve estimates, redo part b to determine how much the carbon tax costs each household and how much revenue it raises.
Finally, redo part b using the values from your long-run demand curve. How does your answer change in comparison to part b and why?