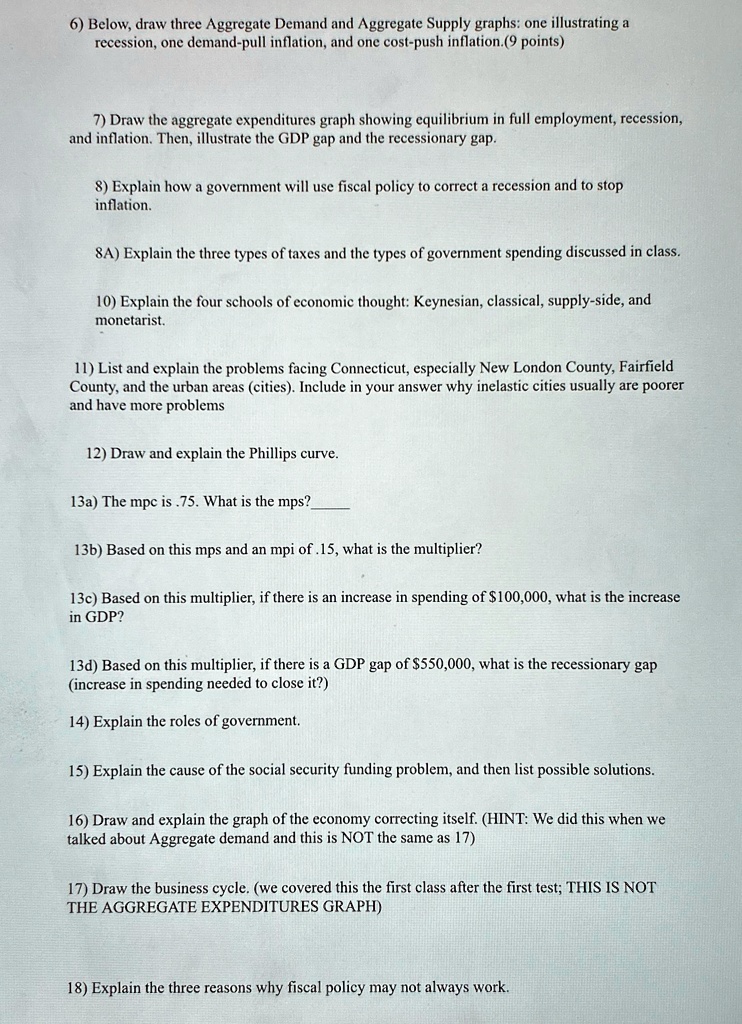
Below, draw three Aggregate Demand and Aggregate Supply graphs: one illustrating a recession, one demand-pull inflation, and one cost-push inflation. (9 points)
7 Draw the aggregate expenditures graph showing equilibrium in full employment, recession, and inflation. Then, illustrate the GDP gap and the recessionary gap.
8 Explain how a government will use fiscal policy to correct a recession and to stop inflation.
8A) Explain the three types of taxes and the types of government spending discussed in class.
10 Explain the four schools of economic thought: Keynesian, classical, supply-side, and monetarist
11 List and explain the problems facing Connecticut, especially New London County, Fairfield County, and the urban areas (cities). Include in your answer why inelastic cities usually are poorer and have more problems
12 Draw and explain the Phillips curve
13a The mpc is .75. What is the mps?
13b) Based on this mps and an mpi of .15, what is the multiplier?
13c Based on this multiplier, if there is an increase in spending of $100,000, what is the increase in GDP?
13d) Based on this multiplier, if there is a GDP gap of $550,000, what is the recessionary gap (increase in spending needed to close it?)
14 Explain the roles of government.
15 Explain the cause of the social security funding problem, and then list possible solutions
16 Draw and explain the graph of the economy correcting itself. (HINT: We did this when we talked about Aggregate demand and this is NOT the same as 17)
17 Draw the business cycle. we covered this the first class after the first test; THIS IS NOT THE AGGREGATE EXPENDITURES GRAPH
18 Explain the three reasons why fiscal policy may not always work.