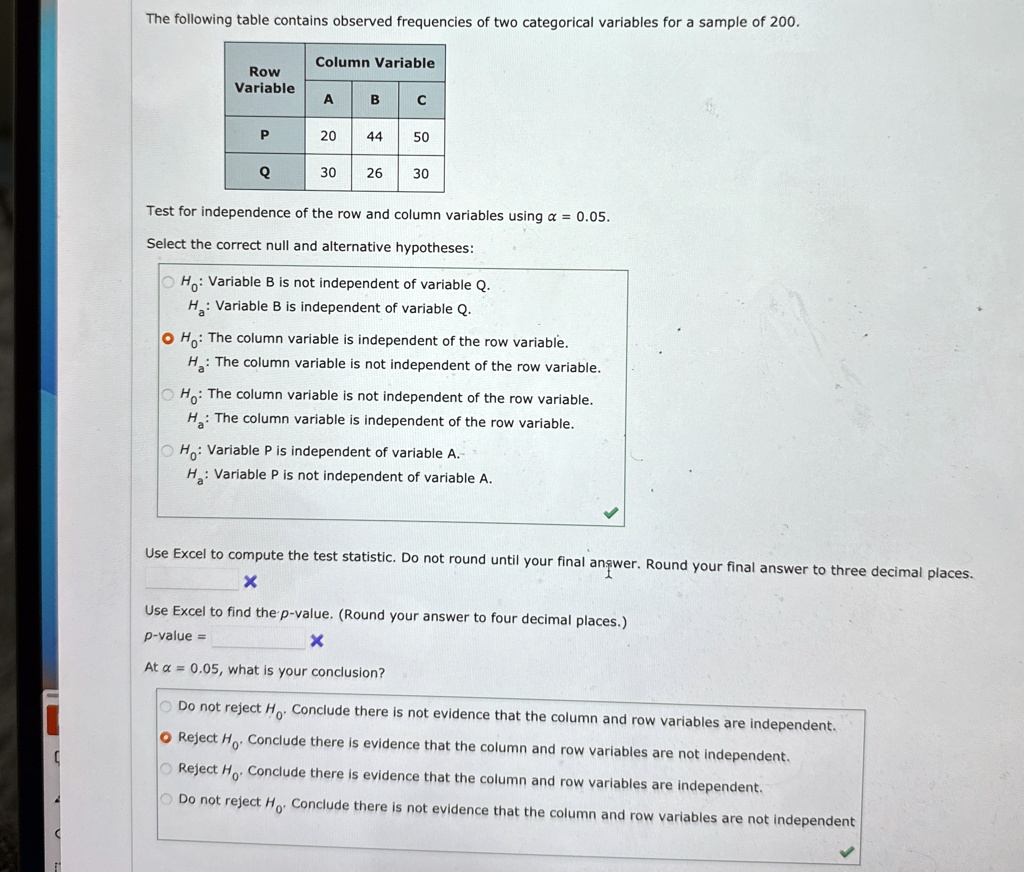
The following table contains observed frequencies of two categorical variables for a sample of 200.
Column Variable
Row
Variable
A
B
C
P
20
44
50
Q
30
26
30
Test for independence of the row and column variables using $\alpha = 0.05$.
Select the correct null and alternative hypotheses:
$H_0$: Variable B is not independent of variable Q.
$H_a$: Variable B is independent of variable Q.
$H_0$: The column variable is independent of the row variable.
$H_a$: The column variable is not independent of the row variable.
$H_0$: The column variable is not independent of the row variable.
$H_a$: The column variable is independent of the row variable.
$H_0$: Variable P is independent of variable A.
$H_a$: Variable P is not independent of variable A.
Use Excel to compute the test statistic. Do not round until your final answer. Round your final answer to three decimal places.
Use Excel to find the p-value. (Round your answer to four decimal places.)
p-value =
At $\alpha = 0.05$, what is your conclusion?
Do not reject $H_0$. Conclude there is not evidence that the column and row variables are independent.
Reject $H_0$. Conclude there is evidence that the column and row variables are not independent.
Reject $H_0$. Conclude there is evidence that the column and row variables are independent.
Do not reject $H_0$. Conclude there is not evidence that the column and row variables are not independent