Exhibit 9.3
$/Q
28
24
22
18
15
10
MC
ATC
D
MR
Q
0 500 900 1,500 1,100 1,700
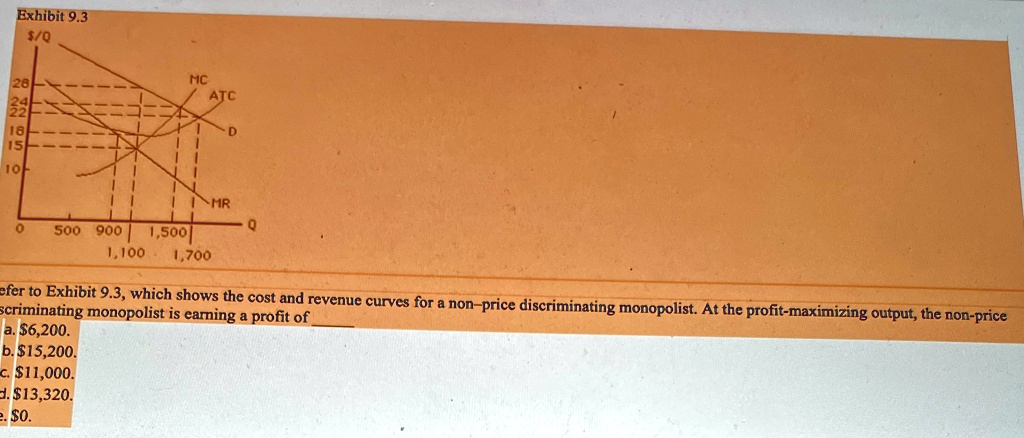
Refer to Exhibit 9.3, which shows the cost and revenue curves for a non-price discriminating monopolist. At the profit-maximizing output, the non-price discriminating monopolist is earning a profit of
a. $6,200.
b. $15,200.
c. $11,000.
d. $13,320.
e. $0.