Texts:
01. Referring to Fig 2d and the attached table, determine whether the average pre-tax income of the top 10%, top 5%, top 1% of households by income has increased or decreased in the recession years of 1980-81, 1990-91, and 2001 (as compared to the immediately prior year). Increased decreased
QUESTION 202. Referring to Fig 2d and the attached table, determine whether the average pre-tax income of the top 10%, top 5%, top 1% of households by income has increased or decreased following the major tax cut years of 1982, 1987, and 2002-03. Increased decreased
QUESTION 303. Referring to Fig 2d and the attached table, determine whether the average federal individual income tax payments of the top 10%, top 5%, top 1% of households by income have increased or decreased in the recession years of 1980-81, 1990-91, and 2001 (as compared to the immediately prior year). Increased decreased
QUESTION 404. Referring to Fig 2d and the attached table, determine whether the average federal individual income tax payments of the top 10%, top 5%, top 1% of households by income have increased or decreased following the major tax cut years of 1982, 1987, and 2002-03. Increased decreased
QUESTION 505. Referring to Fig 2d, the attached table, and your answers to questions 1 through 4, is it reasonable to infer that pre-tax income is a more important determinant of tax revenue than tax rates (assuming that tax cuts are expected to decrease tax revenue)? YES No
QUESTION 606. Referring to Fig 4b and the attached table, determine whether the shares of federal individual income taxes paid by the top 10%, top 5%, top 1% of households by income have increased or decreased in the recession years of 1980-81, 1990-91, and 2001 (as compared to the immediately prior year). Increased decreased
QUESTION 707. Referring to Fig 4b and the attached table, determine whether the shares of federal individual income taxes paid by the top 10%, top 5%, top 1% of households by income have increased or decreased following the major tax cut years of 1982, 1987, and 2002-03. Increased decreased
QUESTION 808. Referring to Fig 4b and the attached table, what is remarkable about the shares of federal individual income taxes paid by the bottom 40% of households by income since 2002? a) The share of federal individual income taxes paid by the bottom 40% has not changed much. b) The share of federal individual income taxes paid by the bottom 40% has been increasing. c) The share of federal individual income taxes paid by the bottom 40% has been decreasing. d) The share of federal individual income taxes paid by the bottom 40% has turned negative.
QUESTION 909. Referring to Fig 4b, the attached table, and your answers to questions 7 and 8 above, is it reasonable to infer that income tax rate cuts tend to increase the share of taxes paid by top income taxpayers? YES NO
QUESTION 1010. In 1979, the share of federal individual income taxes paid by the bottom 80% of taxpayers by income is ______%.
QUESTION 1111. In 2007, the share of federal individual income taxes paid by the bottom 80% of taxpayers by income is ______%.
QUESTION 1212. Referring to Fig 4b, the attached table, and your answers to questions 7, 8, 10, and 11 above, and assuming the "share" of taxes paid is the measure of a "fair share," is it reasonable to infer that the rich DO pay their fair share of federal individual income taxes, especially as compared to the bottom 80% of taxpayers by income? YES NO
QUESTION 13(1a) The Net federal government saving (budget deficit) for the 4th quarter of 2019 is: $______ billions.
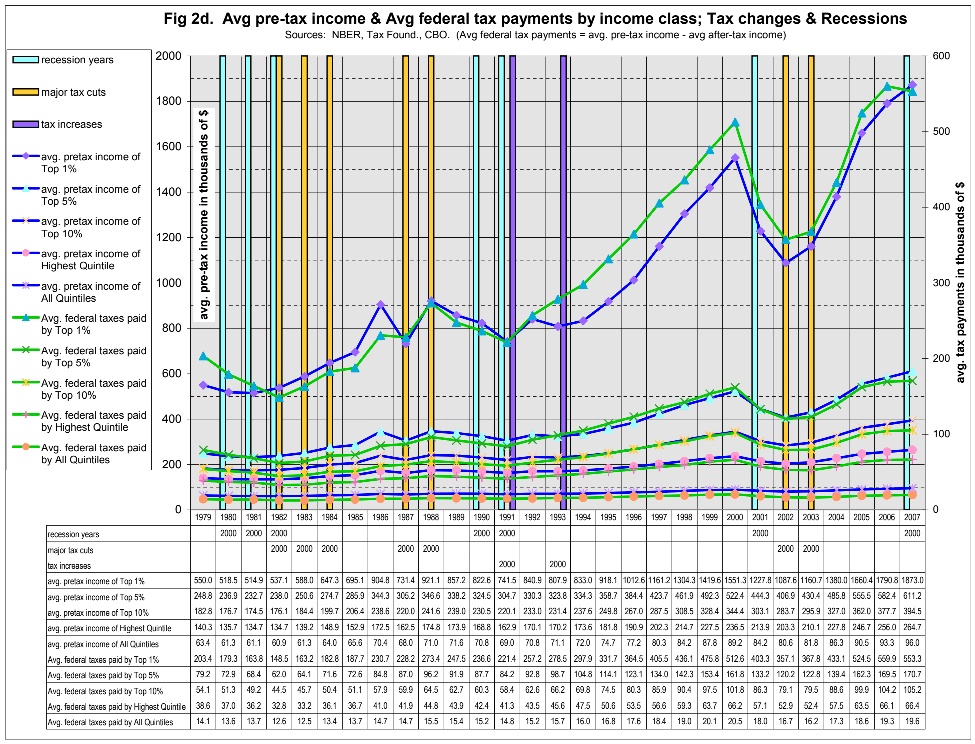
Fig 2d. Avg pre-tax income & Avg federal tax payments by income class; Tax changes & Recessions Sources: NBER, Tax Found., CBO. (Avg federal tax payments = avg. pre-tax income - avg after-tax income)
Recession years
2000
600
Major tax cuts
1800 tax increases 1600 avg. pre-tax income of Top 1% avg. pre-tax income of 1400 Top 5% avg. pre-tax income of avg. pre-tax income in thousands of $ Top 10% 1200 avg. pre-tax income of Highest Quintile avg. pre-tax income of 1000 All Quintiles Avg. federal taxes paid by Top 1% 800 X Avg. federal taxes paid 600 Avg. federal taxes paid by Top 10% Avg. federal taxes paid 400 by Highest Quintile Avg. federal taxes paid by All Quintiles 200
500
of 400 thousands 300 i! tax payments 200 BAB
100
0
1979 1980
1982 1983 1984 1985 1986 1988 1989 1990
1992 1996 1997
2000 2001 2002 2003 2004 2005 2006 2007 2000 2000 2000 2000
Recession years Major tax cuts Tax increases Avg. pre-tax income of Top 1%
2000 2000 2000 2000 2000 2000
2000 2000
2000 2000 550.0 518.5 514.9 537.1 695.1 904.8 731.4 921.1 857.2 822.6 741.5 6048 807.9 833.0 918.1 1012.6 1161.2 1304.3 1419.6 1551.3 1227.8 1087.6 1160.7 1380.0 1660.4 1790.8 1873.0 248.8 236.9 232.7 238.0 250.6 274.7 285.9 344.3 305.2 346.6 338.2 324.5 304.7 330.3 323.8 334.3 358.7 384.4 423.7 461.9 492.3 522.4 797.0 406.9 430.4 485.9 555.5 582.4 611.2 avg. pre-tax income of Top 10% 182.8 176.7 174.5 176.1 184.4 199.7 206.4 238.6 220.0 41.6