Ace - AI Tutor
Ask Our Educators
Textbooks
My Library
Flashcards
Scribe - AI Notes
Notes & Exams
Download App
jose ignacio golden

jose ignacio g.

Divider

Questions asked

BEST MATCH

Suppose we are making predictions of the dependent variable y for specific values of the independent variable x using a simple linear regression model holding the confidence level constant. Let Width (C.I) = the width of the confidence interval for the average value y for a given value of x, and Width (P.I) = the width of the prediction interval for a single value y for a given value of x. Which of the following statements is true? • Width (C.I) < Width (P.I) Width (C.I) > Width (P.I) Width (C.I) = 0.5 Width (P.I) Width (C.I) = Width (P.I)

View Answer
divider
BEST MATCH

A point charge q1q1 = 4.50 nCnC is located on the x-axis at xx = 2.20 mm, and a second point charge q2q2 = -6.00 nCnC is on the y-axis at yy = 1.10 mm. What is the total electric flux due to these two point charges through a spherical surface centered at the origin and with radius r1r1 = 0.620 mm?

View Answer
divider
BEST MATCH

A variety of factors influence enzyme activity. Substrates that bind to the enzyme and interfere with substrate binding or catalysis

View Answer
divider
BEST MATCH

6. An apartment owner replaced the refrigerators and stoves in 7 apartments. The selling price of each refrigerator was $851.49 and each stove, $512.95. Because of the size of the order, a discount of 20% was allowed on the refrigerators and 15% on the stoves. After discounts, the supplier added 9% Provincial Sales tax and the GST of 5%. Calculate the total amount of the invoice that the apartment owner received. (3 marks)

View Answer
divider
BEST MATCH

(b) How many grams of N\textsubscript{2}O are formed if 0.290 moles of NH\textsubscript{4}NO\textsubscript{3} are used in the reaction? Be sure your answer has the correct number of significant digits.

View Answer
divider
BEST MATCH

Write the following sentence regarding a limit symbolically. The limit of the function f(x)=4^x as x approaches 2 is 16.

View Answer
divider
BEST MATCH

A 1.00 cm diameter tube of mercury has a uniform electric field of 1.50 N/C inside the mercury. What is the current flowing through the tube? (The resistivity of mercury is $\rho = 9.58 \times 10^{-7} \Omega \cdot m$)

View Answer
divider
BEST MATCH

Which of the following is an in-kind transfer payment? a. Unemployment insurance b. Workers' compensation c. Social Security d. Temporary Assistance to Needy Families e. Medicaid

View Answer
divider
BEST MATCH

2. In Lecture 15, we studied the 3Color language: 3Color = {(G): the graph G is 3-colorable}. 1 We now consider a related problem that we call the partial 3-coloring problem. In this new problem, we assume that the input graph G has vertex set V = {V1, V2..., Um}, and some of these vertices are already colored. So we are given integers C1, C2,..., Cm ? {0,1,2,3} where \begin{cases} 0 & \text{if } v_i \text{ is not colored yet} \\ 1 & \text{if } v_i \text{ is colored red} \\ 2 & \text{if } v_i \text{ is colored green} \\ 3 & \text{if } v_i \text{ is colored blue} \end{cases} The problem is to decide whether the remaining vertices vi such that c? = 0 can be colored red, green or blue, in such a way that for every edge (i, j), the vertices vi and vj have different colors. We define Partial3Color as the language of all input string (G, C1, C2,..., Cm) corresponding 
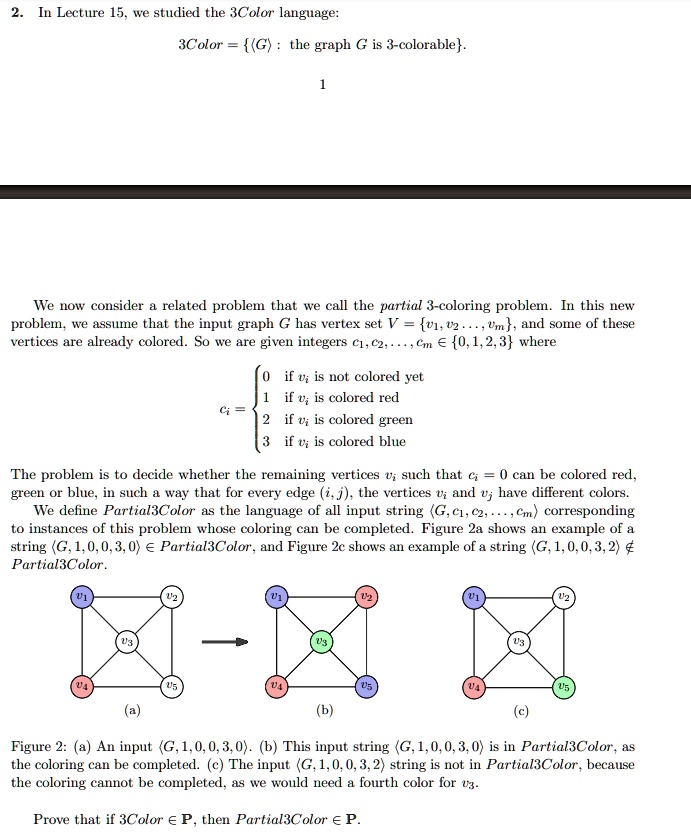
to instances of this problem whose coloring can be completed. Figure 2a shows an example of a string (G, 1,0,0,3,0) ? Partial3Color, and Figure 2c shows an example of a string (G, 1,0,0,3,2) Partial3Color. U1 U2 U1 02 03 U3 U1 U2 03 U4 U5 U4 05 U4 U5 (a) (b) (c) Figure 2: (a) An input (G, 1,0,0,3,0). (b) This input string (G, 1,0,0,3,0) is in Partial3Color, as the coloring can be completed. (c) The input (G, 1, 0, 0, 3, 2) string is not in Partial3Color, because the coloring cannot be completed, as we would need a fourth color for v3. Prove that if 3Color ? P, then Partial3Color ? P.

View Answer
divider
BEST MATCH

TUTORIAL 1b: Measures of Central Tendency and Dispersion Question 5 The table below shows the speed of wind (in meter per second) for the month of December for a certain year. Question 1 A sample of 10 observations are as follow: 75.376.075.077.075.476.3 77,0 74.976.575.8 Calculate the mean, the median and the mode. Describe the shape of the distribution. 00 1.49 Question 2 The following table shows the petrol consumption (RM per week) of 30 families Class Find the mean and the standard deviation of this distribution. 50 99 00 149 150 199 200 249 Question 6 The following table gives the cumulative frequency distribution of entertainment expenditures (in RM) incurred by 50 families during the past week. rof Eamilie Calculate the mean. Question 3 17 Shaun and Hermione conducted an experiment to study a certain characteristic of a population. Below shows the result from their experiment based on 9 different elements: 7,2,5,3,4,1,3,8,6 Obtain the mean and median of their result. If Shaun wrongly recorded 8 (in the data above) as 88, compute again the mean and median. Comparing the answers in parts (a) and (b), which measure of center works better here? Explain your answer. Question 4 The number of sales made last month by each of the 15 members of the sales staff of a company was recorded as follows: Construct a frequency distribution table. Hence, calculate the mean and the standard deviation. Questlon 7 An earlier study showed that the average price of houses sold in a region is RM150,000, A researcher is interested to know whether the price of houses in that region was about to change. The data below give the prices (in thousands of RM) of 25 houses sold recently in that region, which was collected by the researcher. 256 185 713 2 155 101 176 172 209 143 142 101 137 128 124 121 133 77 127 108 139 68 112 123 130 Find the value of the mean and standard deviation. 124 165 150 150 What are the mean and the variance of price of the houses in the collected data? b Organize the data into a suitable frequency table. (Use 5 classes and round up the class width to an integer). Draw a histogram. Hence, estimate the mode from the histogram. d. Calculate the mean, the median and the variance based on the table constructed in part (b

View Answer
divider