Question
y
320
280
240
200
160
120
80
40
10
20
30
40
x
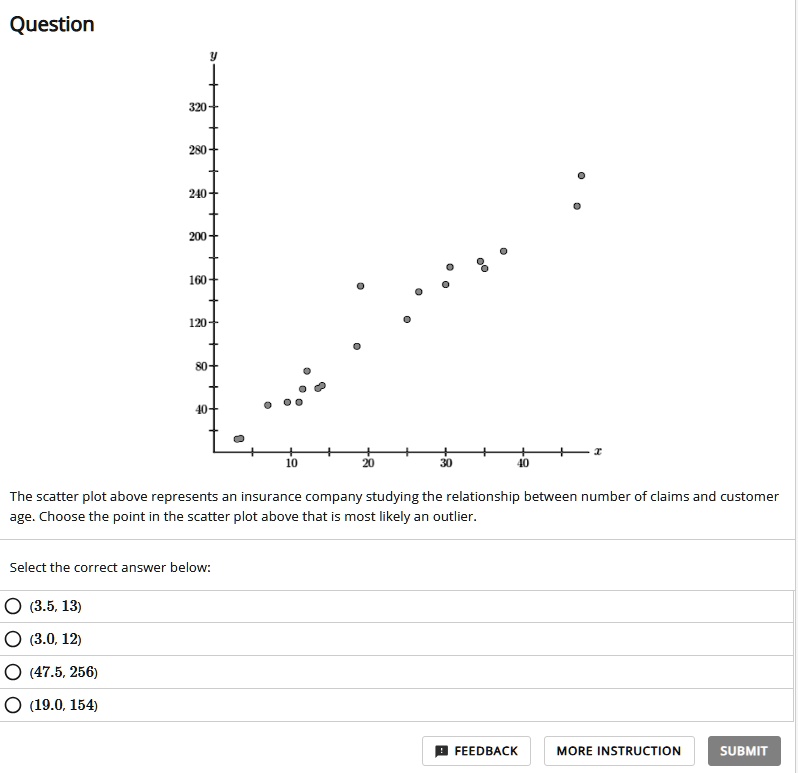
The scatter plot above represents an insurance company studying the relationship between number of claims and customer
age. Choose the point in the scatter plot above that is most likely an outlier.
Select the correct answer below:
(3.5, 13)
(3.0, 12)
(47.5, 256)
(19.0, 154)
FEEDBACK
MORE INSTRUCTION
SUBMIT