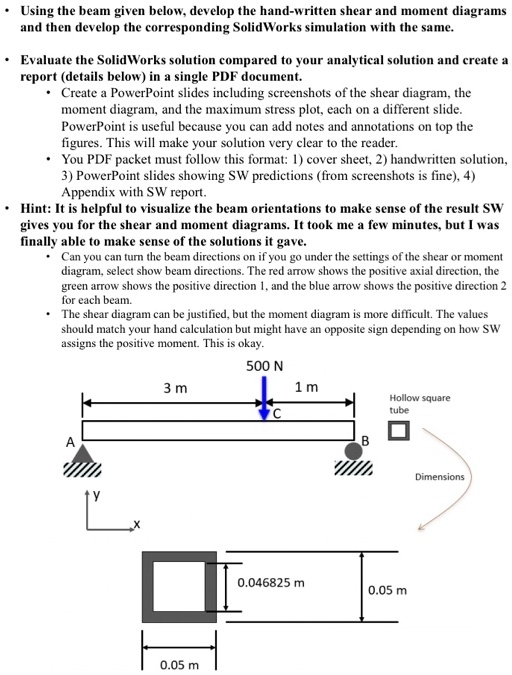
Using the beam given below, develop the hand-written shear and moment diagrams and then develop the corresponding SolidWorks simulation with the same.
• Evaluate the SolidWorks solution compared to your analytical solution and create a report (details below) in a single PDF document.
• Create a PowerPoint slides including screenshots of the shear diagram, the moment diagram, and the maximum stress plot, each on a different slide. PowerPoint is useful because you can add notes and annotations on top the figures. This will make your solution very clear to the reader.
• You PDF packet must follow this format: 1) cover sheet, 2) handwritten solution, 3) PowerPoint slides showing SW predictions (from screenshots is fine), 4) Appendix with SW report.
Hint: It is helpful to visualize the beam orientations to make sense of the result SW gives you for the shear and moment diagrams. It took me a few minutes, but I was finally able to make sense of the solutions it gave.
Can you can turn the beam directions on if you go under the settings of the shear or moment diagram, select show beam directions. The red arrow shows the positive axial direction, the green arrow shows the positive direction 1, and the blue arrow shows the positive direction 2 for each beam.
The shear diagram can be justified, but the moment diagram is more difficult. The values should match your hand calculation but might have an opposite sign depending on how SW assigns the positive moment. This is okay.