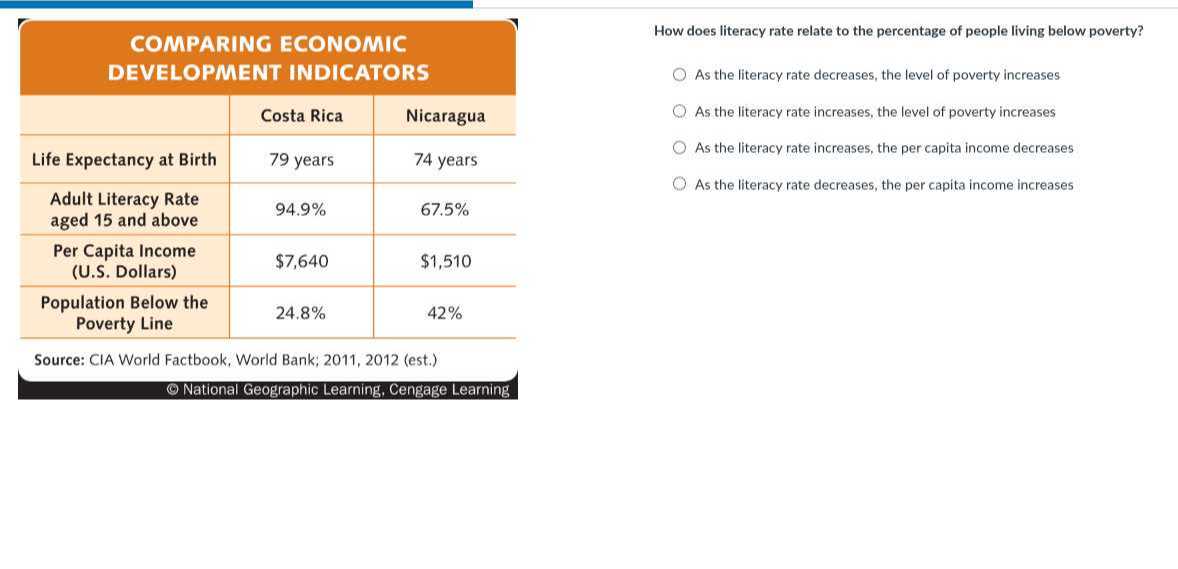
COMPARING ECONOMIC DEVELOPMENT INDICATORS
\begin{tabular}{c|c|c}
\hline & Costa Rica & Nicaragua \\
\hline Life Expectancy at Birth & 79 years & 74 years \\
\hline \begin{tabular}{c}
Adult Literacy Rate \\
aged 15 and above
\end{tabular} & \( 94.9 \% \) & \( 67.5 \% \) \\
\hline \begin{tabular}{c}
Per Capita Income \\
(U.S. Dollars)
\end{tabular} & \( \$ 7,640 \) & \( \$ 1,510 \) \\
\hline \begin{tabular}{c}
Population Below the \\
Poverty Line
\end{tabular} & \( 24.8 \% \) & \( 42 \% \) \\
\hline
\end{tabular}
Source: CIA World Factbook, World Bank; 2011, 2012 (est.)
(9) National Geographic Learning, Cengage Learning
How does literacy rate relate to the percentage of people living below poverty?
As the literacy rate decreases, the level of poverty increases
As the literacy rate increases, the level of poverty increases
As the literacy rate increases, the per capita income decreases
As the literacy rate decreases, the per capita income increases