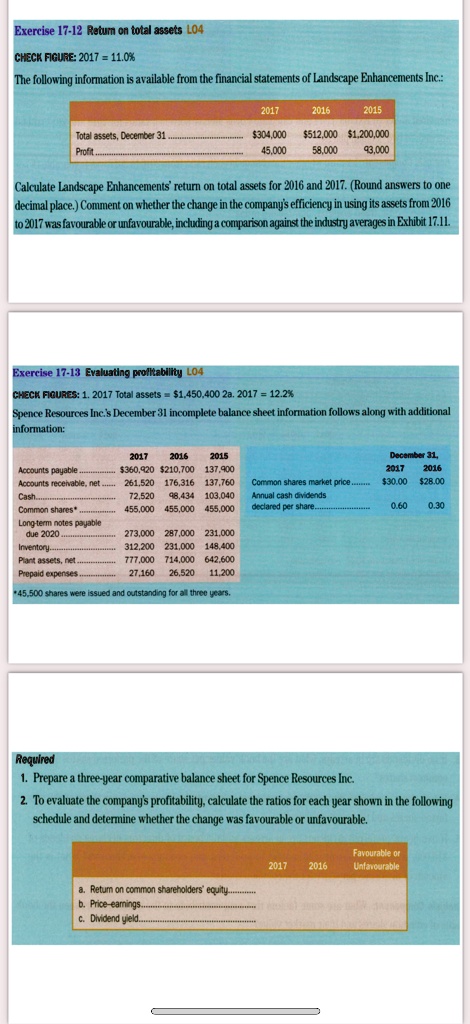
Exercise 17-12 Return on total assets L04
CHECK FIGURE: 2017 = 11.0%
The following information is available from the financial statements of Landscape Enhancements Inc.:
2017
2016
2015
Total assets, December 31 Profit
$304,000 $512,000 $1,200,000 45,000 58,000 93,000
Calculate Landscape Enhancements return on total assets for 2016 and 2017. Round answers to one decimal place. Comment on whether the change in the company's efficiency in using its assets from 2016 to 2017 was favorable or unfavorable, including a comparison against the industry averages in Exhibit 17.11.
Exercise 17-13 Evaluating profitability L04 CHECK FIGURES: 1. 2017 Total assets = $1,450,400 2. 2017 = 12.2% Spence Resources Inc.'s December 31 incomplete balance sheet information follows along with additional information:
2017 2016 2015 $360,920 $210,700 137,900 261,520 176,316 137,760 72,520 98,434 103,040 455,000 455,000 455,000
December 31, 2017 2016 $30.00 $28.00
Accounts payable Accounts receivable, net Cash Common shares* Long-term notes payable due 2020 Inventory Plant assets, net
Common shares market price Annual cash dividends declared per share.
0.60
0.30
273,000 287,000 231,000 312,200 231,000 148,400 777,000 714,000 642,600 27,160 26,520 11,200
45,500 shares were issued and outstanding for all three years
Required 1. Prepare a three-year comparative balance sheet for Spence Resources Inc. 2. To evaluate the company's profitability, calculate the ratios for each year shown in the following schedule and determine whether the change was favorable or unfavorable.
Favorable or Unfavorable
2017
2016
Return on common shareholders equity b. Price earnings c. Dividend yield.