Ace - AI Tutor
Ask Our Educators
Textbooks
My Library
Flashcards
Scribe - AI Notes
Notes & Exams
Download App
joseph byrd

joseph b.

Divider

Questions asked

BEST MATCH

In the mouth, food undergoes both chemical and mechanical digestion. O True O False

View Answer
divider
BEST MATCH

Which institution has the power to impeach the president? Select one: a. The Supreme Court b. The cabinet c. The House of Representatives d. The Senate

View Answer
divider
BEST MATCH

Given the function $f(x) = (x - 5)(x + 2)(x - 6)$\its f-intercept is\its x-intercepts are

View Answer
divider
BEST MATCH

Harry runs a hot dog factory. Beef is a primary ingredient in Harry's hot dogs. Harry has been watching the cattle (beef) futures market and noticed that the 3-month future price is $50 more than the spot (current) price. Which statement is consistent with the speculation reflected in the futures price? Speculators are manipulating the market. There was a disease that killed a large portion of the coffee crop last month. The cost of cattle feed has fallen due to an unexpectedly large crop of hay. There was a disease that killed a large number of swine (a substitute) earlier today.

View Answer
divider
BEST MATCH

Viruses that have arisen recently and are more likely to cause infection than previous strains are called viruses. An example is the influenza virus, which, along with other influenza viruses, is responsible for 30,000 deaths each year in the US. Another example is the virus, a coronavirus that is believed to have originated in bats. The most devastating virus to arise recently is which destroys helper T cells, seriously compromising the immune system.

View Answer
divider
BEST MATCH

Question 7 (5 points) Calculate the mass of 2.25 moles of Mg(NO3)2?

View Answer
divider
BEST MATCH

In 1980 , the population of a city was 6.8 million. By 1992 the population had grown to 9.4 million. Find the rate at which the population of the city was growing.

View Answer
divider
BEST MATCH

The ideal gas law is one example of an equation of state. It relates the pressure, volume, temperature and amount of gas. Another equation of state which better models real gases is the van der Waals equation: $[P + a(n/V)^2](V - nb) = nRT$. In the van der Waals equation, a and b are constants which depend on what type of gas you have. The constant \"a\" is determined by the strength of intermolecular forces and is large for polar molecules like water vapor. The constant \"b\" is determined by the size of the molecules. Larger molecules have larger values for \"b\". (a) Determine the work done by n moles of a van der Waals gas which expands isothermally at a temperature T from a volume $V_1$ to a volume $V_2$.

View Answer
divider
BEST MATCH

Graphing experimental data: Should I make a graph of my data? A graph is used when the data is expected to change for each measurement. Suppose you measure the height of the same tree every year in a biology experiment. You do not expect to get the same answer each year, so it would not make any sense to find the average of the numbers you collect nor does it make sense to find a standard deviation, because each value is supposed to be different. You are interested in how the height of the tree changes over time. All graphs should be done with a computer program for graphing. You can use Excel, or some other graphing program you like, or a graphing calculator as long as it performs the linear regression. Follow the examples below to answer the following questions about the data collected in an experiment when the data is supposed to be in a graph: a) Does the data support the physical model I am exploring? b) What value(s) do I report? c) What if my data does not make a straight line? Example: Suppose you have a small moving cart. You measure the velocity of the cart as it rolls down a ramp at intervals of half a second. The cart accelerates as it rolls down the ramp so that its velocity increases over time. You expect that the acceleration of the cart is approximately constant and the cart's velocity increases linearly with time. You collect the following data for the motion of the cart: t(s) 1.50 2.00 2.50 3.00 3.50 4.00 4.50 5.00 5.50 v(m/s) 8.6 10.1 12.2 13.7 15.4 17.0 19.1 20.5 22.3 The graph of the above data (see next page) was done using LoggerPro graphing program. Note the regression line and the linear regression parameters box on the graph. Note also that each axis on the graph has a label with units included.

View Answer
divider
BEST MATCH

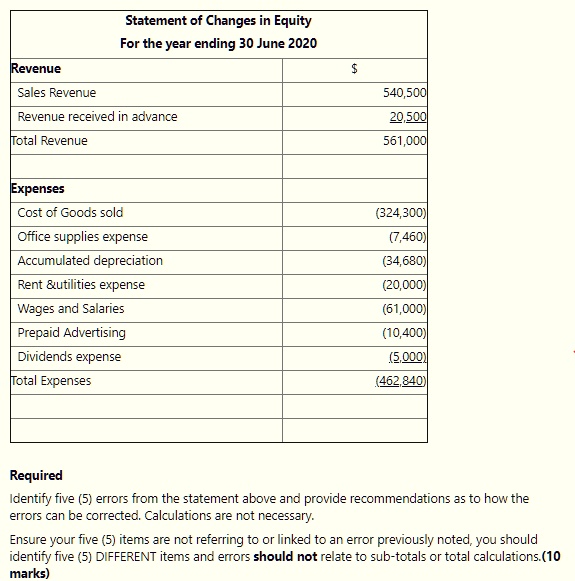
Statement of Changes in Equity For the year ending 30 June 2020 Revenue Sales Revenue Revenue received in advance Total Revenue $ 540,500 20,500 561,000 Expenses Cost of Goods sold (324,300) Office supplies expense (7,460) Accumulated depreciation (34,680) Rent &utilities expense (20,000) Wages and Salaries (61,000) Prepaid Advertising (10,400) Dividends expense (5,000) Total Expenses (462,840) Required Identify five (5) errors from the statement above and provide recommendations as to how the errors can be corrected. Calculations are not necessary. Ensure your five (5) items are not referring to or linked to an error previously noted, you should identify five (5) DIFFERENT items and errors should not relate to sub-totals or total calculations. (10 marks)

View Answer
divider