Consider the given data set. Answer the following scenario as true or false
depending on whether it would be appropriate or not to organize the data into a pie
chart. Explain why or why not.
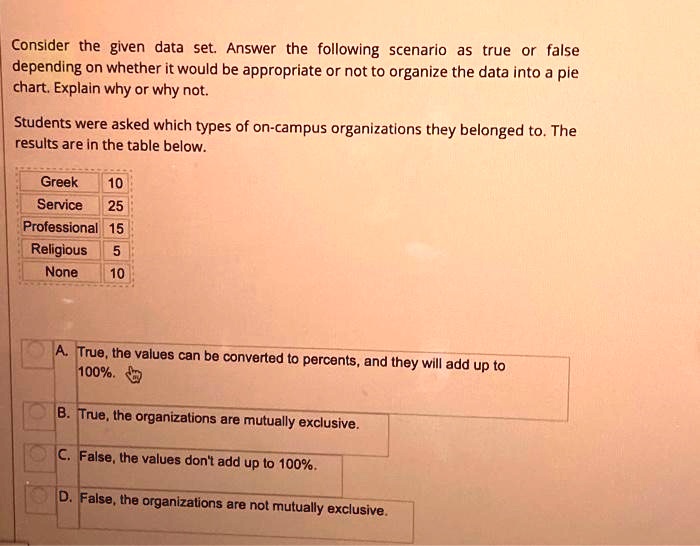
Students were asked which types of on-campus organizations they belonged to. The
results are in the table below.
Greek 10
Service 25
Professional 15
Religious 5
None 10
A. True, the values can be converted to percents, and they will add up to
100%.
B. True, the organizations are mutually exclusive.
C. False, the values don't add up to 100%.
D. False, the organizations are not mutually exclusive.