There are two drugs P and Q that inhibit AK2's activity. You only have 3 nmoles of AK2 remaining
from your original purification. You decide to test these inhibitors in the lab by setting up three
separate 10mL-reactions. You follow the reactions using a spectrophotometer and you generate this
dataset.
Calculate:
Kinetic parameters Vmax, Km and turnover number for AK2.
The apparent Km when the inhibitors are added.
The type of inhibition caused by each of the compounds.
Justify why you think this may be the case.
Enter the data into your own excel spreadsheet, and graph the data just like I did in class.
Remember to perform XY scatter plots and not any of the other options (line, area, columns, etc).
Otherwise you will not be able to obtain meaningful data.
Turn in your M-M and Lineweaver-Burke graphs, all calculations and answers to the questions
to me in class (hard copy) after Spring Break, March 18^(th ).
Important: use 8 (yes, eight) decimal places to do all calculations, otherwise numbers vary wildly.
To report enzyme parameters, use only 2 decimal places, and add appropriate units.
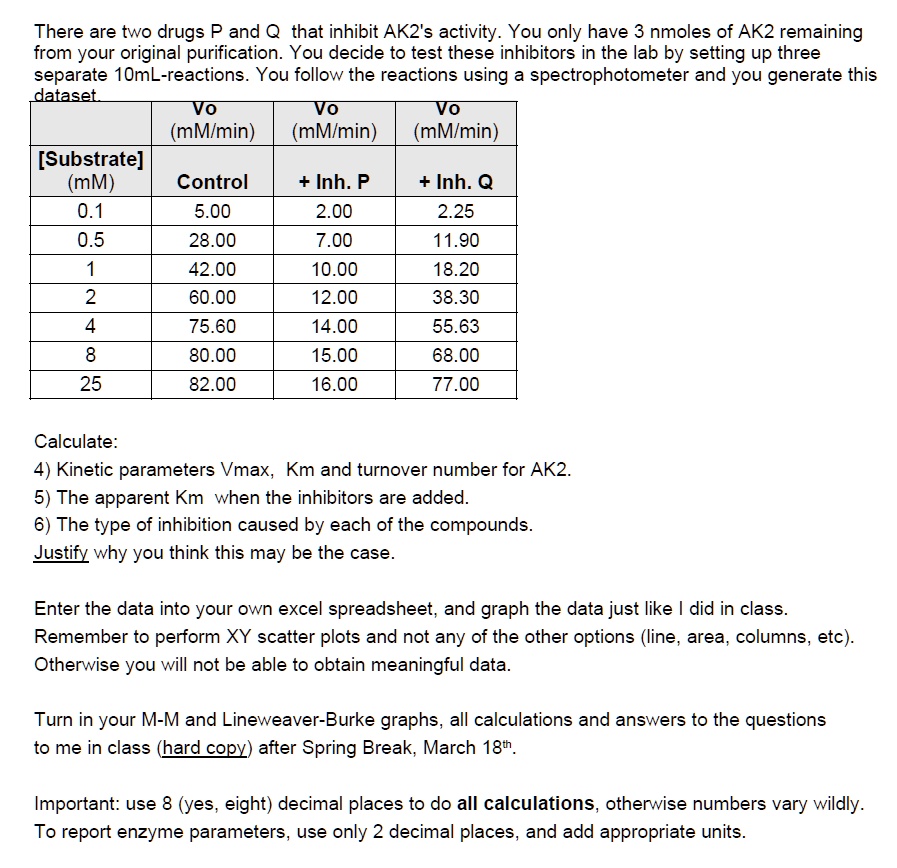
There are two drugs P and Q that inhibit AK2's activity. You only have 3 nmoles of AK2 remaining from your original purification.You decide to test these inhibitors in the lab by setting up three separate 10mL-reactions. You follow the reactions using a spectrophotometer and you generate this dataset Vo Vo Vo (mM/min) (mM/min) (mM/min) [Substrate] (mM) Control + Inh. P + Inh. Q 0.1 5.00 2.00 2.25 0.5 28.00 7.00 11.90 1 42.00 10.00 18.20 2 60.00 12.00 38.30 4 75.60 14.00 55.63 8 80.00 15.00 68.00 25 82.00 16.00 77.00
Calculate: 4) Kinetic parameters Vmax, Km and turnover number for AK2
5) The apparent Km when the inhibitors are added.
6) The type of inhibition caused by each of the compounds.
Justify why you think this may be the case.
Enter the data into your own excel spreadsheet, and graph the data just like I did in class. Remember to perform XY scatter plots and not any of the other options (line, area, columns, etc). Otherwise you will not be able to obtain meaningful data.
Turn in your M-M and Lineweaver-Burke graphs, all calculations and answers to the questions to me in class (hard copy) after Spring Break, March 18th.
Important: use 8 (yes,eight) decimal places to do all calculations, otherwise numbers vary wildly To report enzyme parameters, use only 2 decimal places, and add appropriate units