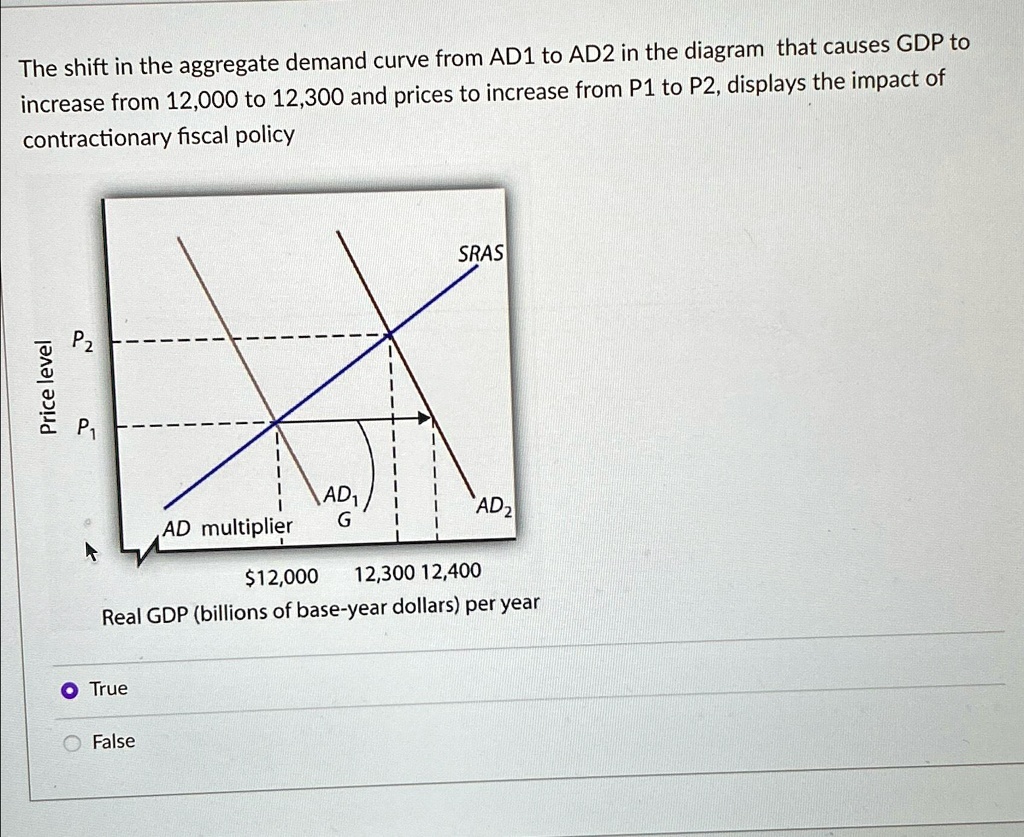
The shift in the aggregate demand curve from AD1 to AD2 in the diagram that causes GDP to
increase from 12,000 to 12,300 and prices to increase from P1 to P2, displays the impact of
contractionary fiscal policy
Price level
P2
AD multiplier
AD1
G
$12,000
SRAS
AD2
12,300 12,400
Real GDP (billions of base-year dollars) per year
• True
False