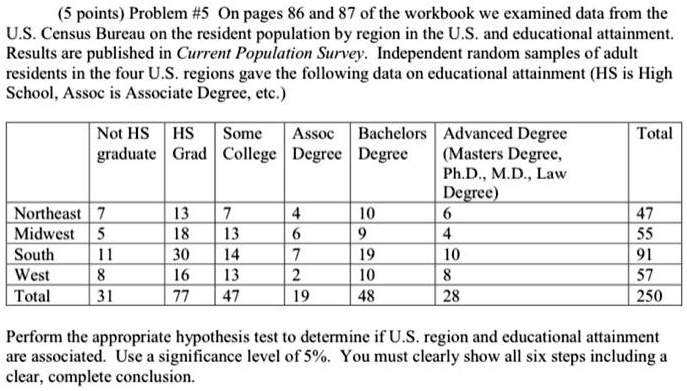
(5 points) Problem #5 On pages 86 and 87 of the workbook we examined data from the
U.S. Census Bureau on the resident population by region in the U.S. and educational attainment.
Results are published in Current Population Survey. Independent random samples of adult
residents in the four U.S. regions gave the following data on educational attainment (HS is High
School, Assoc is Associate Degree, etc.)
\begin{tabular}{|l|c|c|c|c|c|c|c|}
\hline
& Not HS & HS & Some & Assoc & Bachelors & Advanced Degree & Total \\
& graduate & Grad & College & Degree & Degree & (Masters Degree, \\
& & & & & & Ph.D., M.D., Law \\
& & & & & & Degree) \\
\hline
Northeast & 7 & 13 & 7 & 4 & 10 & 6 & 47 \\
Midwest & 5 & 18 & 13 & 6 & 9 & 4 & 55 \\
South & 11 & 30 & 14 & 7 & 19 & 10 & 91 \\
West & 8 & 16 & 13 & 2 & 10 & 8 & 57 \\
Total & 31 & 77 & 47 & 19 & 48 & 28 & 250 \\
\hline
\end{tabular}
Perform the appropriate hypothesis test to determine if U.S. region and educational attainment
are associated. Use a significance level of 5%. You must clearly show all six steps including a
clear, complete conclusion.