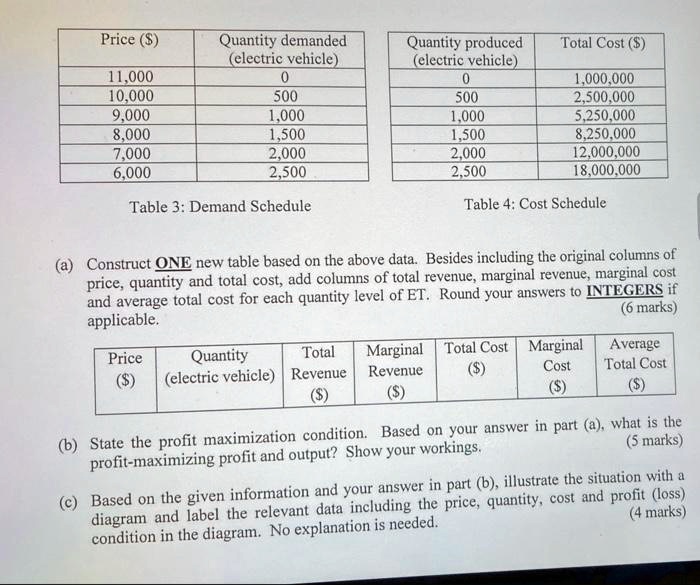
Price ($)
Quantity demanded
(electric vehicle)
Quantity produced
(electric vehicle)
Total Cost ($)
11,000
0
0
1,000,000
10,000
500
500
2,500,000
9,000
1,000
1,000
5,250,000
8,000
1,500
1,500
8,250,000
7,000
2,000
2,000
12,000,000
6,000
2,500
2,500
18,000,000
Table 3: Demand Schedule
Table 4: Cost Schedule
(a) Construct ONE new table based on the above data. Besides including the original columns of
price, quantity and total cost, add columns of total revenue, marginal revenue, marginal cost
and average total cost for each quantity level of ET. Round your answers to INTEGERS if
applicable.
(6 marks)
Price
($)
Quantity
(electric vehicle)
Total
Revenue
($)
Marginal
Revenue
($)
Total Cost Marginal Average
($)
Cost
Total Cost
($)
($)
(b) State the profit maximization condition. Based on your answer in part (a), what is the
profit-maximizing profit and output? Show your workings.
(5 marks)
(c) Based on the given information and your answer in part (b), illustrate the situation with a
diagram and label the relevant data including the price, quantity, cost and profit (loss)
condition in the diagram. No explanation is needed.
(4 marks)