Need the total asset turnover for the current year of Samsung AA15-3 Extended Analysis LOA1
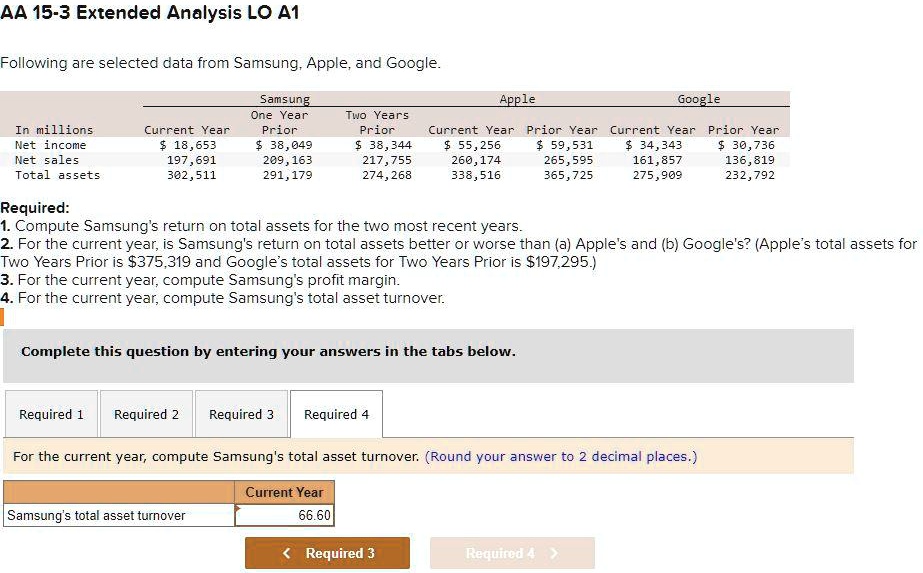
Following are selected data from Samsung, Apple, and Google:
Samsung One Year Prior $38,049 209,163 291,179
Apple
Google
Two Years Prior Current Year Prior Year Current Year Prior Year $38,344 $55,256 $59,531 $30,736 217,755 260,174 265,595 161,857 136,819 274,268 338,516 365,725 275,909 232,792
In millions Net income Net sales Total assets
Current Year $18,653 197,691 302,511
Required:
1. Compute Samsung's return on total assets for the two most recent years.
2. For the current year, is Samsung's return on total assets better or worse than (a) Apple's and (b) Google's? Apple's total assets for Two Years Prior is $375,319 and Google's total assets for Two Years Prior is $197,295.
3. For the current year, compute Samsung's profit margin.
4. For the current year, compute Samsung's total asset turnover.
Complete this question by entering your answers in the tabs below.
Required 1
Required 2
Required 3
Required 4
For the current year, compute Samsung's total asset turnover (Round your answer to 2 decimal places.)
Current Year 66.60
Samsung's total asset turnover
Required 3
Required 4