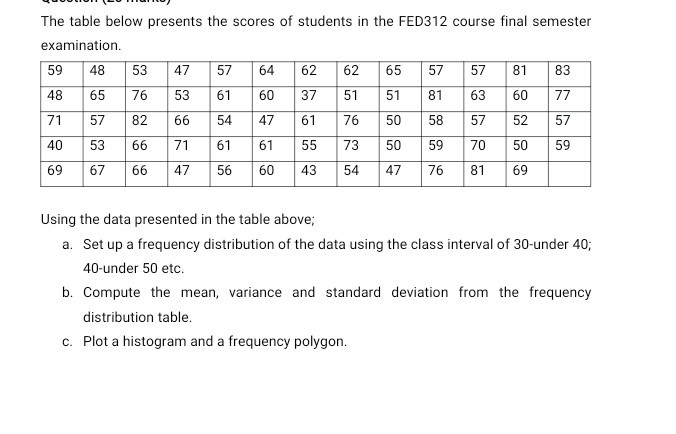
The table below presents the scores of students in the FED312 course final semester examination.
\begin{tabular}{|l|l|l|l|l|l|l|l|l|l|l|l|l|}
\hline 59 & 48 & 53 & 47 & 57 & 64 & 62 & 62 & 65 & 57 & 57 & 81 & 83 \\
\hline 48 & 65 & 76 & 53 & 61 & 60 & 37 & 51 & 51 & 81 & 63 & 60 & 77 \\
\hline 71 & 57 & 82 & 66 & 54 & 47 & 61 & 76 & 50 & 58 & 57 & 52 & 57 \\
\hline 40 & 53 & 66 & 71 & 61 & 61 & 55 & 73 & 50 & 59 & 70 & 50 & 59 \\
\hline 69 & 67 & 66 & 47 & 56 & 60 & 43 & 54 & 47 & 76 & 81 & 69 & \\
\hline
\end{tabular}
Using the data presented in the table above;
a. Set up a frequency distribution of the data using the class interval of 30 -under 40 ; 40 -under 50 etc.
b. Compute the mean, variance and standard deviation from the frequency distribution table.
c. Plot a histogram and a frequency polygon.