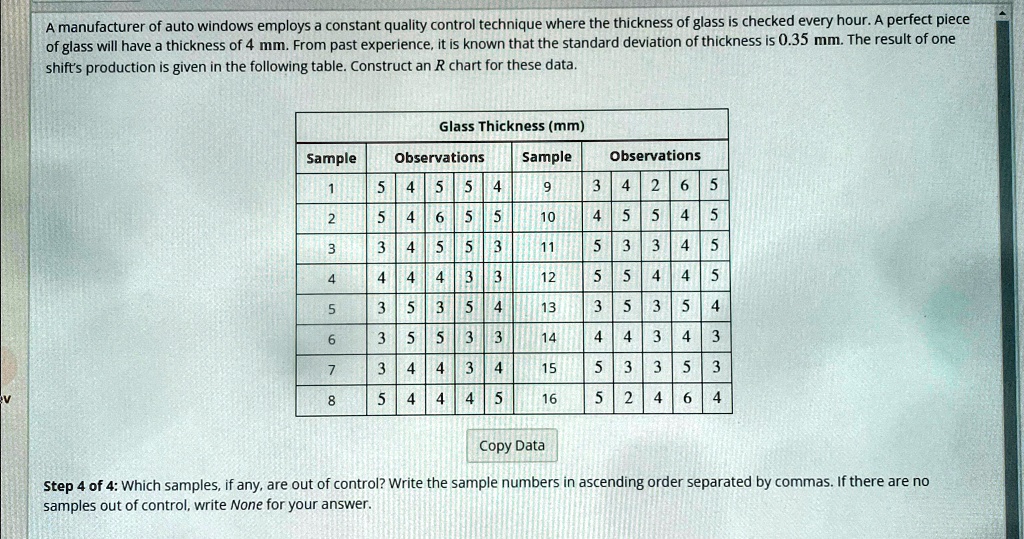
A manufacturer of auto windows employs a constant quality control technique where the thickness of glass is checked every hour. A perfect piece
of glass will have a thickness of 4 mm. From past experience, it is known that the standard deviation of thickness is 0.35 mm. The result of one
shift's production is given in the following table. Construct an R chart for these data.
Glass Thickness (mm)
Sample
Observations
Sample
Observations
1
5 4 5 5 4
9
3 4 2 6 5
2
5 4 6 5 5
10
4 5 5 4 5
3
3 4 5 5 3
11
5 3 3 4 5
4
4 4 4 3 3
12
5 5 4 4 5
5
3 5 3 5 4
13
3 5 3 5 4
6
3 5 5 3 3
14
4 4 3 4 3
7
3 4 4 3 4
15
5 3 3 5 3
8
5 4 4 4 5
16
5 2 4 6 4
Copy Data
Step 4 of 4: Which samples, if any, are out of control? Write the sample numbers in ascending order separated by commas. If there are no
samples out of control, write None for your answer.