XYZ Insurance Co wants to buy a block of structured settlement annuities.
The expected cash flows of the block have been calculated by the actuary of the selling company. They are the following:
Liab
Year Cash Flows
1 2,000,000
2 2,000,000
3 2,000,000
4 125,000,000
5 5,000,000
6 5,000,000
7 100,000,000
8 4,000,000
9 20,000,000
10 60,000,000
11 80,000,000
12 5,000,000
13 5,000,000
14 5,000,000
15 10,000,000
16 5,000,000
17 5,000,000
18 5,000,000
19 4,498,685
20 100,000,000
This block is supported by a portfolio of three assets:
• 5-Year Bond - 5% coupon - €40,000,000
• 10-Year Bond - 5% coupon - €60,000,000
• 20-Year Bond - 5% coupon - €245,000,000
For this analysis, you will work only with annual cash flows. Therefore, you will assume that the coupons on the bonds are paid annually at the end of the year and also that the liability cash flows occur at the end of the year.
Also, you will assume the market rate on all assets is 5%.
The task in this exercise is to project the net cash flow from the assets and liabilities. At the end of each period, the company has to either fund this cash flow (if it is negative) or reinvest the cash if it is positive. If the cash flow is negative, it will sell assets (shortest assets first) to cover the negative balance. If it is positive, it will reinvest the excess in 1-year bonds paying the current market rate. Remember, when it sells an asset, its market value is the present value of future cash flows discounted at the current market rate. Other points to note:
• The market value of an asset is based on the interest rate in that period.
• The one-year bond gets reinvested at the rate available in the year it is purchased.
• If a portion of an asset is sold, its remaining face will decrease proportionate to the amount of market value sold.
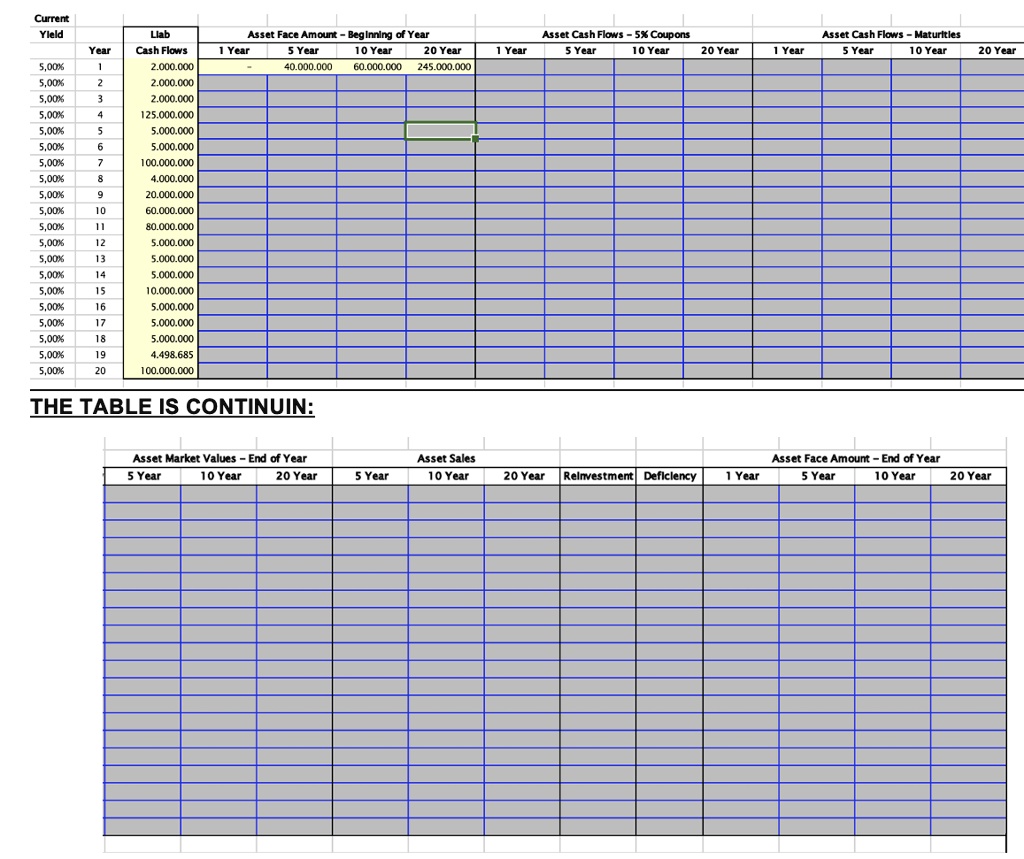
COMPLETE THE FOLLOWING TABLE:
Current Yield
Liab Cash Flows 2,000,000 2,000,000 2,000,000 125,000,000 5,000,000 5,000,000 100,000,000 4,000,000 20,000,000 60,000,000 80,000,000 5,000,000 5,000,000 5,000,000 10,000,000 5,000,000 5,000,000 5,000,000 4,498,685 100,000,000
Asset Face Amount -- Beginning of Year 1 Year 5 Year 10 Year 20 Year - 40,000,000 60,000,000 245,000,000
Asset Cash Flows 5% Coupons 1 Year 5 Year 10 Year 20 Year
Asset Cash Flows - Maturities 5 Year 10 Year
Year 1 2 3
1 Year
20 Year
5.00% 5.00% 5.00% 5.00% 5.00% 5.00% 5.00% 5.00% 5.00% 5.00% 5.00% 5.00% 5.00% 5.00% 5.00% 5.00% 5.00% 5.00% 5.00% 5.00%
5
6
8 9 10 11 12 13 14 15 16 17 18 19 20
THE TABLE IS CONTINUING:
Asset Market Values -- End of Year 5 Year 10 Year 20 Year
Asset Sales 10 Year
Asset Face Amount End of Year 1 Year 5 Year 10 Year 20 Year
5 Year
20 Year
Reinvestment Deficiency