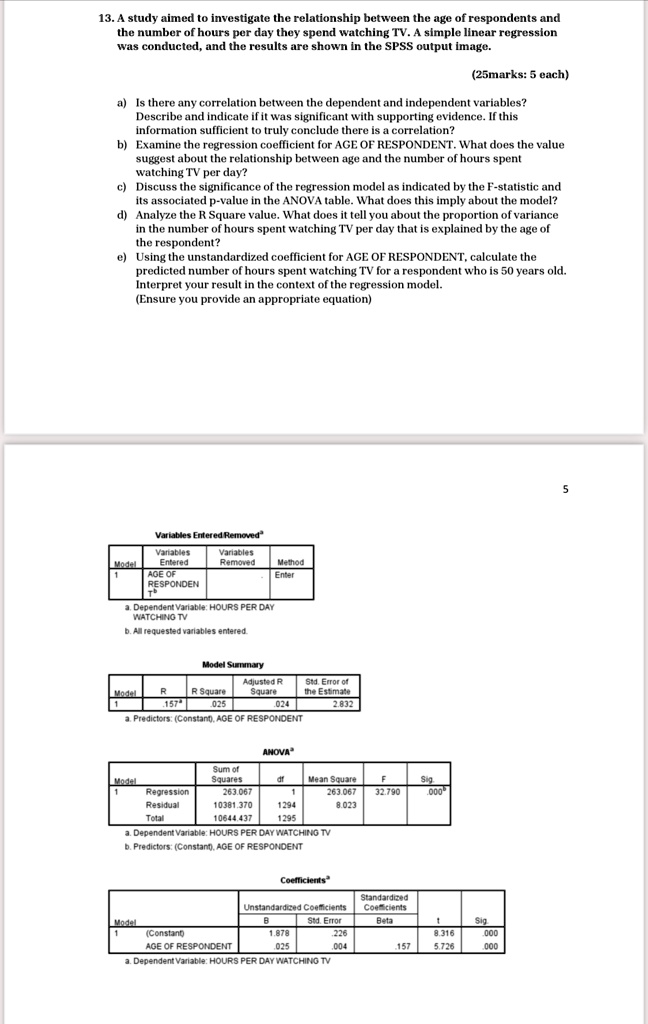
A study aimed to investigate the relationship between the age of respondents and the number of hours per day they spend watching TV. A simple linear regression was conducted, and the results are shown in the SPSS output image.
25 marks: 5 each
a) Is there any correlation between the dependent and independent variables? Describe and indicate if it was significant with supporting evidence. If this information sufficient to truly conclude there is a correlation?
b) Examine the regression coefficient for AGE OF RESPONDENT. What does the value suggest about the relationship between age and the number of hours spent watching TV per day?
c) Discuss the significance of the regression model as indicated by the F-statistic and its associated p-value in the ANOVA table. What does this imply about the model?
d) Analyze the R Square value. What does it tell you about the proportion of variance in the number of hours spent watching TV per day that is explained by the age of the respondent?
e) Using the unstandardized coefficient for AGE OF RESPONDENT, calculate the predicted number of hours spent watching TV for a respondent who is 50 years old. Interpret your result in the context of the regression model. (Ensure you provide an appropriate equation)
Variables Entered/Removed:
Model:
Variables Entered: AGE OF RESPONDENT
Variables Removed: None
Method: Enter
a. Dependent Variable: HOURS PER DAY WATCHING TV
b. All requested variables entered.
Model Summary:
Adjusted R Square: 0.157
Std. Error of the Estimate: 2.832
Predictors: (Constant), AGE OF RESPONDENT
ANOVA:
Sum of Squares: Model - 263.067, Residual - 10381.370, Total - 10644.437
Mean Square: Model - 263.067, Residual - 8.023
Dependent Variable: HOURS PER DAY WATCHING TV
Predictors: (Constant), AGE OF RESPONDENT
F-statistic: 32.790, p-value: 0.000
Coefficients:
Standardized Coefficients: Unstandardized Coefficients
(Constant): 1.878, 0.226
AGE OF RESPONDENT: 0.025, 0.004
Dependent Variable: HOURS PER DAY WATCHING TV