Task 3:
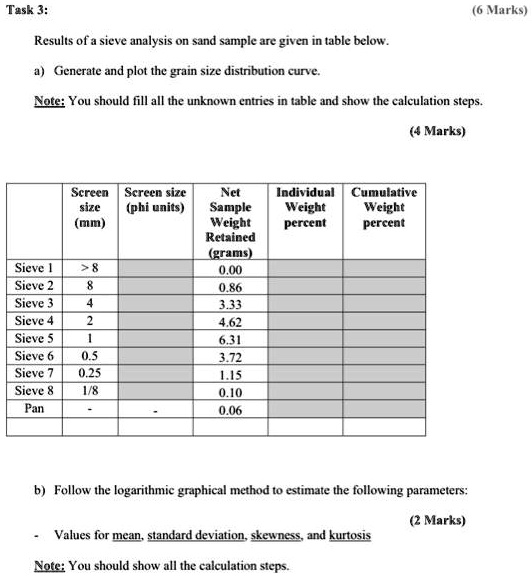
Results of a sieve analysis on sand sample are given in table below.
a) Generate and plot the grain size distribution curve.
(6 Marks)
Note: You should fill all the unknown entries in table and show the calculation steps.
(4 Marks)
Screen
Screen size
Net
Individual Cumulative
size
(phi units)
Sample
Weight Weight
(mm)
Weight
percent
percent
Retained
(grams)
Sieve 1
>8
0.00
Sieve 2
8
0.86
Sieve 3
4
3.33
Sieve 4
2
4.62
Sieve 5
1
6.31
Sieve 6
0.5
3.72
Sieve 7
0.25
1.15
Sieve 8
1/8
0.10
Pan
-
0.06
b) Follow the logarithmic graphical method to estimate the following parameters:
Values for mean, standard deviation, skewness, and kurtosis
(2 Marks)
Note: You should show all the calculation steps.