SECTION-B
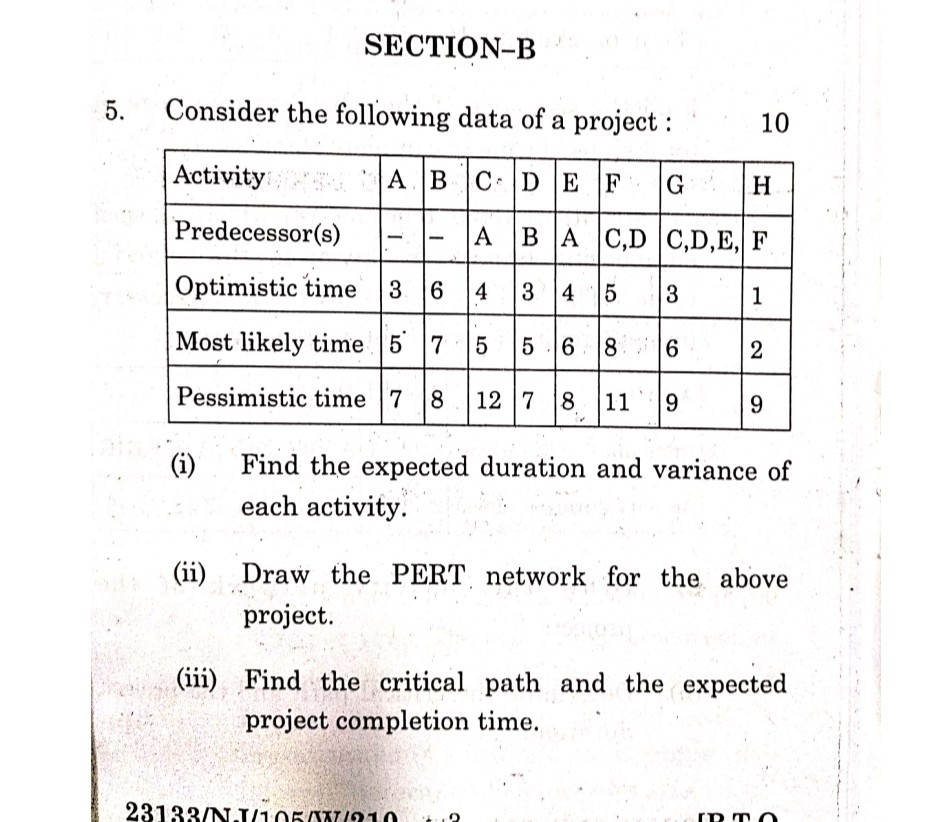
5. Consider the following data of a project :
10
\begin{tabular}{|l|l|l|l|l|l|l|l|l|}
\hline Activity & A & B & C & D & E & F & G & H \\
\hline Predecessor(s) & - & - & A & B & A & C,D & C,D,E, & F \\
\hline Optimistic time & 3 & 6 & 4 & 3 & 4 & 5 & 3 & 1 \\
\hline Most likely time & 5 & 7 & 5 & 5 & 6 & 8 & 6 & 2 \\
\hline Pessimistic time & 7 & 8 & 12 & 7 & 8 & 11 & 9 & 9 \\
\hline
\end{tabular}
(i) Find the expected duration and variance of each activity.
(ii) Draw the PERT network for the above project.
(iii) Find the critical path and the expected project completion time.