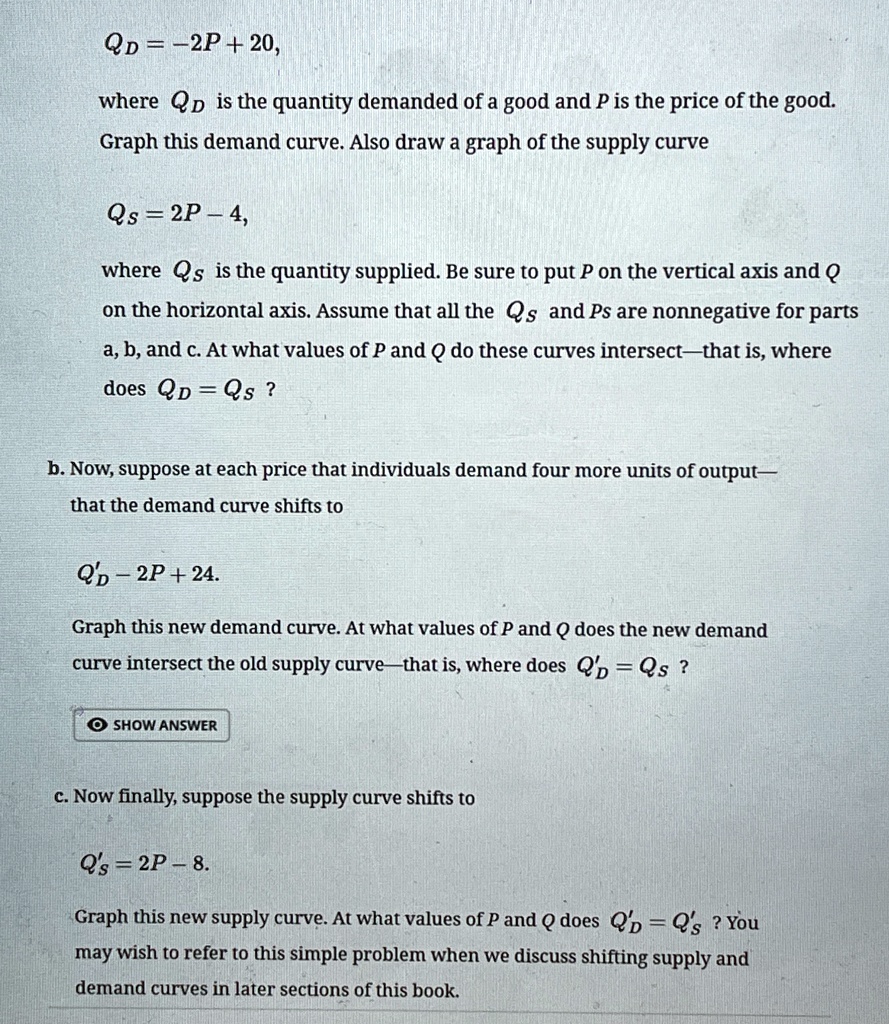
$Q_D = -2P + 20$,
where $Q_D$ is the quantity demanded of a good and $P$ is the price of the good.
Graph this demand curve. Also draw a graph of the supply curve
$Q_S = 2P - 4$,
where $Q_S$ is the quantity supplied. Be sure to put $P$ on the vertical axis and $Q$
on the horizontal axis. Assume that all the $Q_S$ and $P$s are nonnegative for parts
a, b, and c. At what values of $P$ and $Q$ do these curves intersect—that is, where
does $Q_D = Q_S$?
b. Now, suppose at each price that individuals demand four more units of output—
that the demand curve shifts to
$Q'_D = -2P + 24$.
Graph this new demand curve. At what values of $P$ and $Q$ does the new demand
curve intersect the old supply curve—that is, where does $Q'_D = Q_S$?
c. Now finally, suppose the supply curve shifts to
$Q'_S = 2P - 8$.
Graph this new supply curve. At what values of $P$ and $Q$ does $Q'_D = Q'_S$? You
may wish to refer to this simple problem when we discuss shifting supply and
demand curves in later sections of this book.