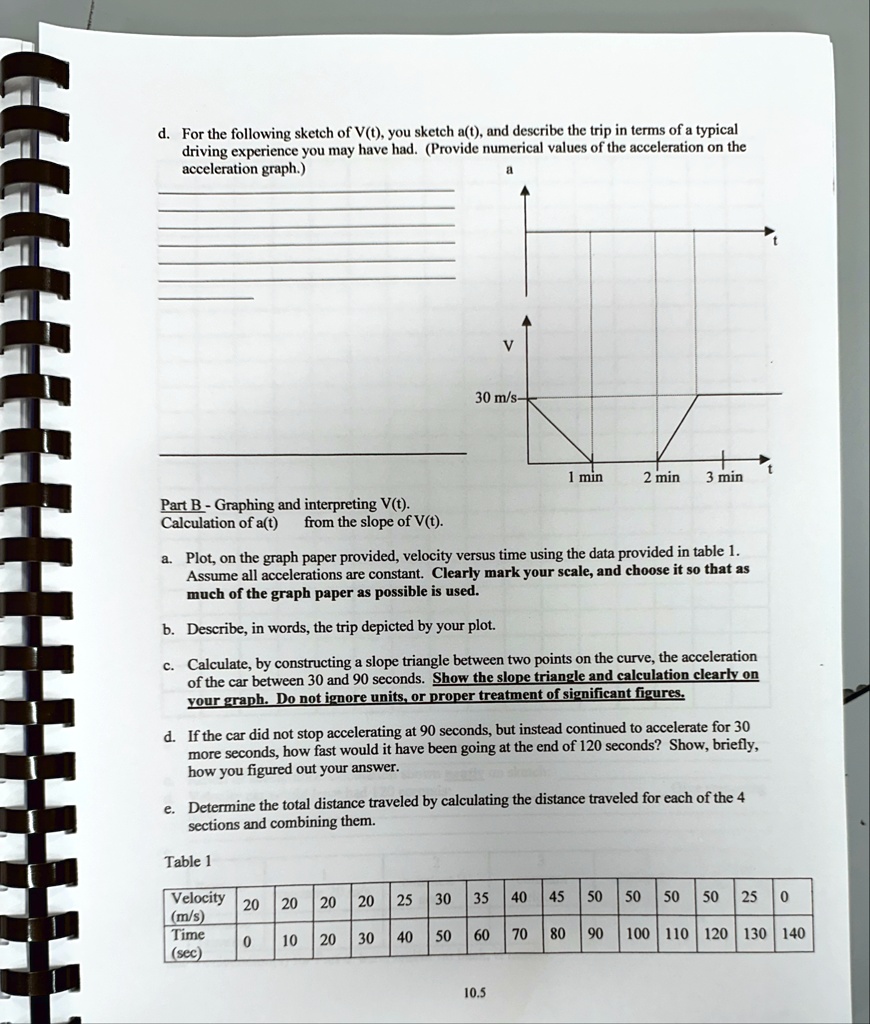
d. For the following sketch of V(t), you sketch a(t), and describe the trip in terms of a typical
driving experience you may have had. (Provide numerical values of the acceleration on the
acceleration graph.)
a
V
30 m/s-
+
1 min
2 min
3 min
Part B - Graphing and interpreting V(t).
Calculation of a(t) from the slope of V(t).
a. Plot, on the graph paper provided, velocity versus time using the data provided in table 1.
Assume all accelerations are constant. Clearly mark your scale, and choose it so that as
much of the graph paper as possible is used.
b. Describe, in words, the trip depicted by your plot.
c. Calculate, by constructing a slope triangle between two points on the curve, the acceleration
of the car between 30 and 90 seconds. Show the slope triangle and calculation clearly on
your graph. Do not ignore units, or proper treatment of significant figures.
d. If the car did not stop accelerating at 90 seconds, but instead continued to accelerate for 30
more seconds, how fast would it have been going at the end of 120 seconds? Show, briefly,
how you figured out your answer.
e. Determine the total distance traveled by calculating the distance traveled for each of the 4
sections and combining them.
Table 1
Velocity 20 20 20 20 25 30 35
40 45 50
50 50 50
25 0
(m/s)
Time 0
20 10
30 40
50 60 70 80 90
100 110 120 130 140
(sec)