12. [-/1.02 Points]
DETAILS
MY NOTES
LARAPCALC10 2.1.064.
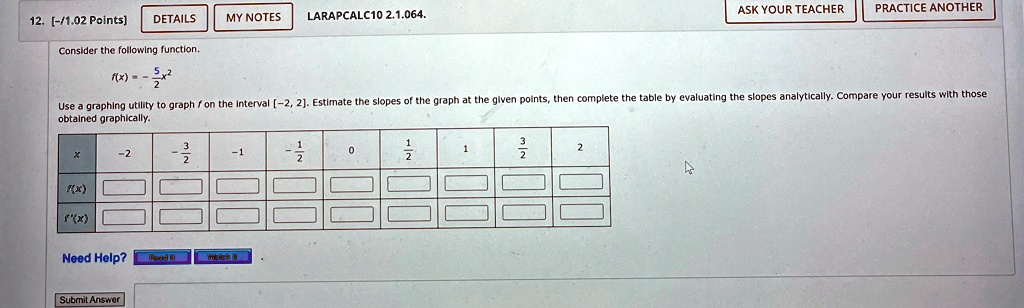
Consider the following function.
f(x) = -\frac{5}{2}x^2
Use a graphing utility to graph $f$ on the interval $[-2, 2]$. Estimate the slopes of the graph at the given points, then complete the table by evaluating the slopes analytically. Compare your results with those obtained graphically.
\begin{tabular}{|c|c|c|c|c|c|c|c|}
\hline
x & -2 & -\frac{3}{2} & -1 & -\frac{1}{2} & 0 & \frac{1}{2} & 1 & \frac{3}{2} & 2 \\
\hline
f(x) & & & & & & & \\
\hline
f'(x) & & & & & & & \\
\hline
\end{tabular}