Ace - AI Tutor
Ask Our Educators
Textbooks
My Library
Flashcards
Scribe - AI Notes
Notes & Exams
Download App
J P

J P.

Divider

Questions asked

ANSWERED

Jon Southam verified

Numerade educator

a. State H0 and Ha and identify the claim. What is the null hypothesis, H0? A. The distribution of motivations is 111 rewards, 98 low rate, 107 cash back, 48 discounts, and 61 other. B. The distribution of motivations is 28% rewards, 23% low rate, 21% cash back, 7% discounts, and 21% other. C. The distribution of motivations differs from the old survey. What is the alternate hypothesis, Ha? A. The distribution of motivations is 111 rewards, 98 low rate, 107 cash back, 48 discounts, and 61 other. B. The distribution of motivations is 28% rewards, 23% low rate, 21% cash back, 7% discounts, and 21% other. C. The distribution of motivations differs from the old survey. Which hypothesis is the claim? H0 b) Determine the critical value, ?0^2, and the rejection region. ?0^2 = _____ (Round to three decimal places as needed.) Choose the correct rejection region below. A. ?^2 < ?0^2 B. ?^2 ? ?0^2 C. ?^2 = ?0^2 D. ?^2 ? ?0^2 (c) Calculate the test statistic. ?^2 = _____ (Round to three decimal places as needed.) (d) Decide whether to reject or fail to reject the null hypothesis. Then interpret the decision in the context of the original claim. At the 2.5% significance level, there ____ enough evidence to conclude that the distribution of motivations ____ the old survey.

View Answer
divider
INSTANT ANSWER

\( \$ 900 \). The equation of the regression line is \( \hat{y}=1.426 x-17.678 \). (Round to the nearest cent as needed.)

View Answer
divider
ANSWERED

Jon Southam verified

Numerade educator

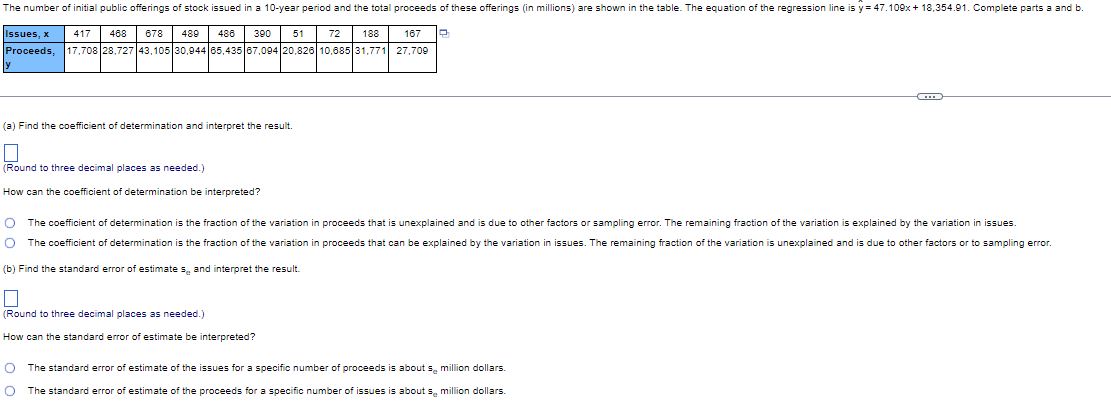
The number of initial public offerings of stock issued in a 10-year period and the total proceeds of these offerings (in millions) are shown in the table. The equation of the regression line is y = 47.109x + 18,354.91. Complete parts a and b. Issues, x: 417, 468, 678, 489, 486, 390, 51, 72, 188, 167 Proceeds, y: 17,708, 28,727, 43,105, 30,944, 65,435, 67,094, 20,826, 10,685, 31,771, 27,709 (a) Find the coefficient of determination and interpret the result. (Round to three decimal places as needed.) How can the coefficient of determination be interpreted? The coefficient of determination is the fraction of the variation in proceeds that is unexplained and is due to other factors or sampling error. The remaining fraction of the variation is explained by the variation in issues. The coefficient of determination is the fraction of the variation in proceeds that can be explained by the variation in issues. The remaining fraction of the variation is unexplained and is due to other factors or to sampling error. (b) Find the standard error of estimate s_e and interpret the result. (Round to three decimal places as needed.) How can the standard error of estimate be interpreted? The standard error of estimate of the issues for a specific number of proceeds is about s_e million dollars. The standard error of estimate of the proceeds for a specific number of issues is about s_e million dollars.

View Answer
divider
ANSWERED

Federico Castro verified

Numerade educator

Find the equation of the regression line for the given data. Then construct a scatter plot of the data and draw the regression line. (The pair of variables have a significant correlation.) Then use the regression equation to predict the value of y for each of the given x-values, if meaningful. The table below shows the heights (in feet) and the number of stories of six notable buildings in a city. Height, x: 775, 619, 519, 508, 491, 474 Stories, y: 53, 47, 46, 43, 37, 36 (a) x = 502 feet (b) x = 647 feet (c) x = 802 feet (d) x = 734 feet Find the regression equation. y = []x + ([]) (Round the slope to three decimal places as needed. Round the y-intercept to two decimal places as needed.) Choose the correct graph below. (a) Predict the value of y for x = 502. Choose the correct answer below. A. 48 B. 40 C. 52 D. not meaningful (b) Predict the value of y for x = 647. Choose the correct answer below. A. 55 B. 40 C. 48 D. not meaningful (c) Predict the value of y for x = 802. Choose the correct answer below. A. 48 B. 55 C. 52 D. not meaningful (d) Predict the value of y for x = 734. Choose the correct answer below. A. 40 B. 55 C. 52 D. not meaningful

View Answer
divider
ANSWERED

Jon Southam verified

Numerade educator

Hours, x 0 1 2 4 4 5 5 6 7 8 Test score, y 37 42 53 54 61 69 75 76 85 92

View Answer
divider
ANSWERED

Katy Gimbel verified

Numerade educator

The ages (in years) of 10 men and their systolic blood pressures (in millimeters of mercury) are shown in the attached data table with a sample correlation coefficient r of 0.908. Remove the data entry for the man who is 49 years old and has a systolic blood pressure of 199 millimeters of mercury from the data set and find the new correlation coefficient. Describe how this affects the correlation coefficient r. Use technology. Click the icon to view the data set. The new correlation coefficient r going from 0.908 to . (Round to three decimal places as needed.) Data table Age, x Systolic blood pressure, y 18 109 25 122 39 145 46 133 49 199 63 186 71 198 29 130 57 176 22 117

View Answer
divider