Chapter 4 Measuring Corporate Performance 113 MINICASE
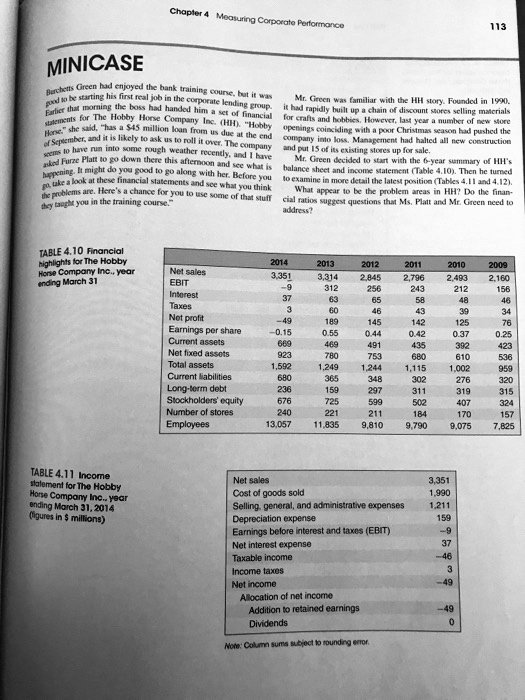
Mr. Green was familiar with the HH story. Founded in 1990, it had rapidly built up a chain of discount stores selling materials for crafts and hobbies. However, last year a number of new store openings coinciding with a poor Christmas season had pushed the company into a loss. Management had halted all new construction and put 15 of its existing stores up for sale. Mr. Green decided to start with the 6-year summary of HH's balance sheet and income statement (Table 4.10). Then he turned to examine in more detail the latest position (Tables 4.11 and 4.12). Financial ratios suggest questions that Ms. Platt and Mr. Green need to address.
TABLE 4.10 Financial Hobby Horse Company Inc., year ending March 31
Net sales EBIT Interest Taxes Net profit Earnings per share Current assets Net fixed assets Total assets Current liabilities Long-term debt Stockholders' equity Number of stores Employees
2014 3,351 -9 37
2013 3,314 312 63 60 189 0.55 469 780 1,249 365 159 725 221 11,835
2012 2,845 256 65 46 145 0.44 491 753 1,244 348 297 599 211 9,810
2011 2,796 243 58 43 142 0.42 435 099 1,115 302 311 502 184 9,790
2010 2,493
2009 2,160 212 156 48 46 39 34 125 76 0.37 0.25 392 423 610 536 1,002 959 276 320 319 315 407 324 170 157 9,075 7,825
49 -0.15 669 923 1,592 680 236 676 240 13,057
TABLE 4.11 Income statement for The Hobby Horse Company Inc., year ending March 31, 2014 (figures in $ millions)
Net sales Cost of goods sold Selling, general, and administrative expenses Depreciation expense Earnings before interest and taxes (EBIT) Net interest expense Taxable income Income taxes Net income Allocation of net income Addition to retained earnings Dividends NoCum sums subject to rounding error.
3,351 1,990 1,211 159 -9 37 -46 3 -49
-49 0