Compute and Interpret Coverage, Liquidity and Solvency Ratios
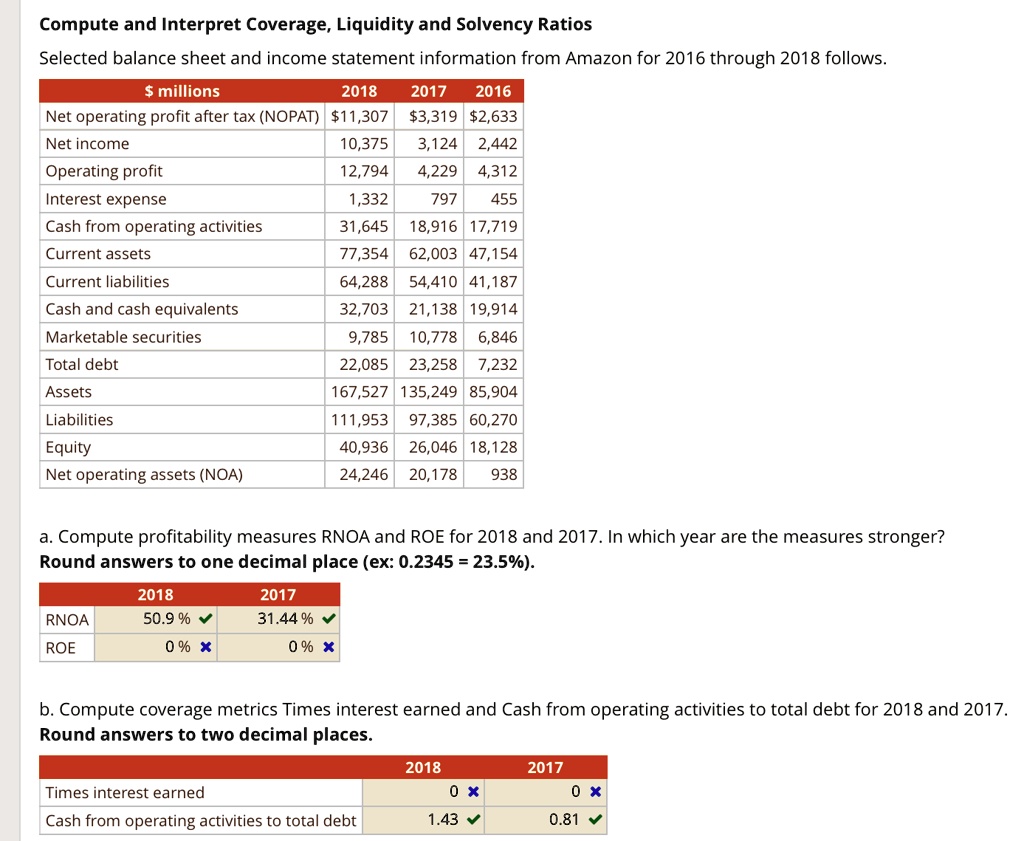
Selected balance sheet and income statement information from Amazon for 2016 through 2018 follows.
$ millions
2018 2017 2016
Net operating profit after tax (NOPAT) $11,307 $3,319 $2,633
Net income 10,375 3,124 2,442
Operating profit 12,794 4,229 4,312
Interest expense 1,332 797 455
Cash from operating activities 31,645 18,916 17,719
Current assets 77,354 62,003 47,154
Current liabilities 64,288 54,410 41,187
Cash and cash equivalents 32,703 21,138 19,914
Marketable securities 9,785 10,778 6,846
Total debt 22,085 23,258 7,232
Assets 167,527 135,249 85,904
Liabilities 111,953 97,385 60,270
Equity 40,936 26,046 18,128
Net operating assets (NOA) 24,246 20,178 938
a. Compute profitability measures RNOA and ROE for 2018 and 2017. In which year are the measures stronger?
Round answers to one decimal place (ex: 0.2345 = 23.5%).
RNOA 2018 2017
50.9% 31.44%
ROE 0% x 0% x
b. Compute coverage metrics Times interest earned and Cash from operating activities to total debt for 2018 and 2017.
Round answers to two decimal places.
2018 2017
Times interest earned 0 x 0 x
Cash from operating activities to total debt 1.43 0.81