Q5
10 Points
What drinks do people prefer? While I was buying groceries the other day, I had to wait in my
car for some time outside the store to double check some items on my shopping list and to
verify a few things to pick up for an older neighbor of mine. While waiting, I noticed that many
people leaving the store had some amount of bottles or cans in their carts. I had generally
guessed that the distribution would be approximately 50% who prefer water, 20% who prefer
what I'll call \"brown soft drinks\" (Coke, Pepsi, Dr. Pepper, Root Beer), 20% who prefer \"not so
soft drinks\" (which includes beer and other packs of glass bottles, and 10% who prefer
something else. My neighbor took a while to call back, so I got quite a bit of data, outlined in the
table below.
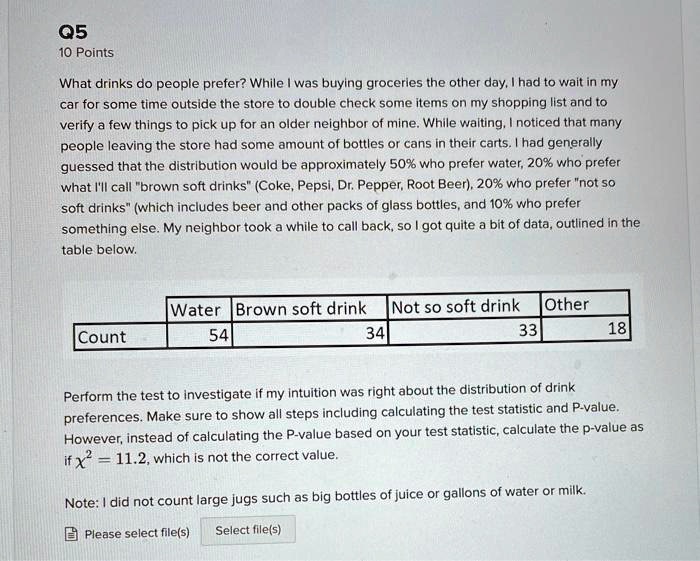
Count
Water Brown soft drink Not so soft drink Other
54
34
33
18
Perform the test to investigate if my intuition was right about the distribution of drink
preferences. Make sure to show all steps including calculating the test statistic and P-value.
However, instead of calculating the P-value based on your test statistic, calculate the p-value as
if $\chi^2 = 11.2$, which is not the correct value.
Note: I did not count large jugs such as big bottles of juice or gallons of water or milk.
Please select file(s) Select file(s)