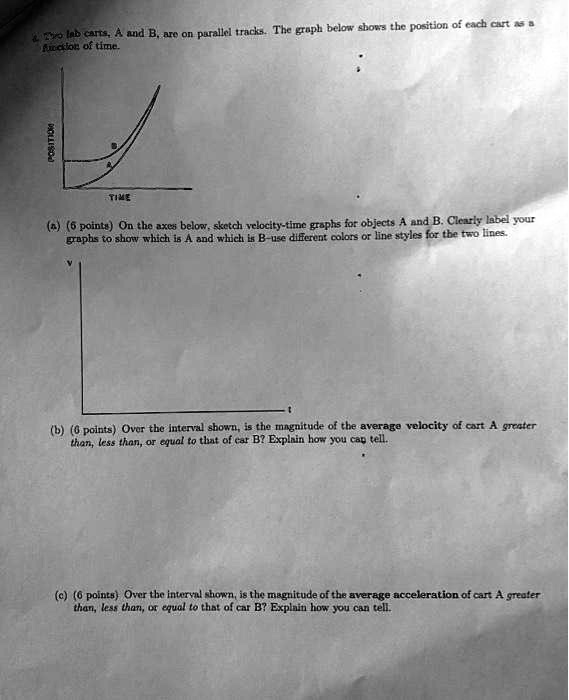
Two lab carts, A and B, are on parallel tracks. The graph below shows the position of each cart as a function of time.
(a) (6 points) On the axes below, sketch velocity-time graphs for objects A and B. Clearly label your graphs to show which is A and which is B-use different colors or line styles for the two lines.
(b) (6 points) Over the interval shown, is the magnitude of the average velocity of cart A greater than, less than, or equal to that of car B? Explain how you can tell.
(c) (6 points) Over the interval shown, is the magnitude of the average acceleration of cart A greater than, less than, or equal to that of car B? Explain how you can tell.