Ace - AI Tutor
Ask Our Educators
Textbooks
My Library
Flashcards
Scribe - AI Notes
Notes & Exams
Download App
katherine tran

katherine t.

Divider

Questions asked

BEST MATCH

Question 19 Although, health gets a lot of coverage in the media, it: Answer a. is a simple construct that helps separate healthy people from sick people b. is a way to ensure that governments will spend money on climate change and homelessness c. is a term that we won't worry about once artificial intelligence becomes understood more clearly in society d. is just a way to have governments look like they are functioning by spending money e. does not represent a dichotomy of health versus illness Not yet answered Marked out of 1.00

View Answer
divider
BEST MATCH

Estimate the annual number of cattle and hogd shipped into the US for breeding and feeding

View Answer
divider
BEST MATCH

Compared with the chytrid growing requirements we learned about in class, Drs. Sonn and Richards-Zawacki found that the chytrid infecting these frogs were even more sensitive to high temperatures. The chytrid fungus in this study began to show significant growth and reproduction declines at roughly 23-25°C. This is a significantly lower temperature threshold than is typical for the species globally. Given these temperature requirements, which figure is the best prediction for chytrid fungal load in northern cricket frogs exposed to chytrid in different temperature conditions? A 5 B C 4 Bd load (log DNA copies per swab) 3 4 Bd load (log DNA copies per swab) 3 4 Bd load (log DNA copies per swab) 3 2 LA January (7-17°C) OH May (11-23 °C) OH July (18-28°C) LA July (22-32 °C) 2 2 LA January (7-17°C) OH May (11-23 °C) OH July (18-28°C) LA July (22-32 °C) LA January (7-17°C) OH May (11-23°C) OH July (18-28 °C) LA July (22-32 °C) Figure A Figure B Figure C

View Answer
divider
BEST MATCH

True or false Pseudomembranous inflammation refers to fibrinous inflammation of mucous membrane

View Answer
divider
BEST MATCH

Sketch the graph of the following hyperbola. Specify the coordinates of the vertices and foci, and find the equations of the asymptotes. Use a graphing utility to check your work.\\ \frac{y^2}{100} - \frac{x^2}{81} = 1\\The vertices of the hyperbola are (Type an ordered pair. Type an exact answer, using radicals as needed. Use a comma to separate answers as needed.)\\The foci of the hyperbola are (Type an ordered pair. Type an exact answer, using radicals as needed. Use a comma to separate answers as needed.)\\Determine the equations of the asymptotes. Choose the correct answer below.\\A. $y = \frac{9}{10}x$ and $y = -\frac{9}{10}x$\\C. $y = \frac{100}{81}x$ and $y = -\frac{100}{81}x$\\Graph the hyperbola. Choose the correct graph below.\\A. B. C. D.

View Answer
divider
BEST MATCH

What is the index of hydrogen deficiency of this compound? (a) 1 (b) 2 (c) 3 (d) 4

View Answer
divider
BEST MATCH

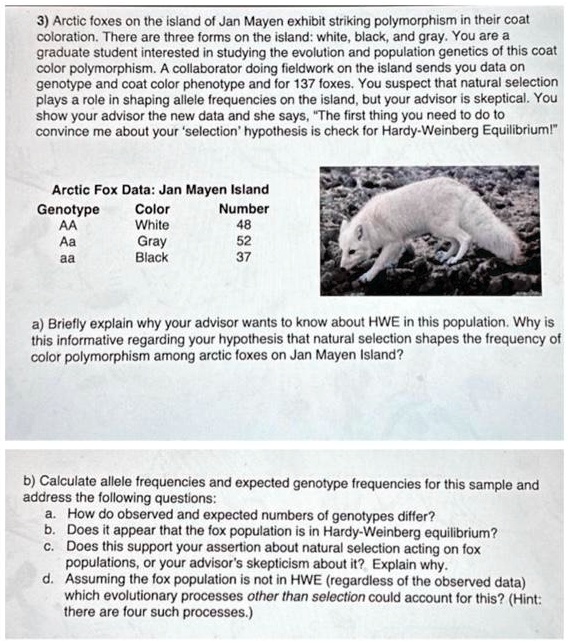
b) To calculate the allele frequencies and expected genotype frequencies, we can use the following formulas: Allele frequencies: p = (2 * number of AA individuals + number of Aa individuals) / (2 * total number of individuals) q = (2 * number of aa individuals + number of Aa individuals) / (2 * total number of individuals) Expected genotype frequencies: AA = p^2 * total number of individuals Aa = 2 * p * q * total number of individuals aa = q^2 * total number of individuals a) The observed numbers of genotypes differ from the expected numbers because the observed numbers are based on actual data collected from the population, while the expected numbers are calculated assuming the population is in Hardy-Weinberg equilibrium. Any deviation from the expected numbers suggests that some evolutionary process, such as natural selection, is acting on the population. b) To determine if the fox population is in Hardy-Weinberg equilibrium, we compare the observed genotype frequencies to the expected genotype frequencies. If the observed frequencies match the expected frequencies, then the population is in Hardy-Weinberg equilibrium. If there are significant differences between the observed and expected frequencies, then the population is not in equilibrium. c) If the observed genotype frequencies do not match the expected frequencies, it suggests that some evolutionary process, such as natural selection, is acting on the population. This supports the assertion that natural selection shapes the frequency of color polymorphism among arctic foxes on Jan Mayen Island. d) If the fox population is not in Hardy-Weinberg equilibrium, there are four evolutionary processes other than selection that could account for this: 1. Genetic drift: Random changes in allele frequencies due to chance events. 2. Gene flow: Introduction of new alleles into the population through migration. 3. Mutation: Occurrence of new alleles through genetic mutations. 4. Non-random mating: Preference for certain traits or avoidance of certain traits in mate selection.
View Answer
divider
BEST MATCH

Refer to the following graph. P MC ATC P AVC Q The perfectly competitive firm depicted is currently: A) incurring a loss that is larger than total fixed cost, and so the firm should shut down. B) earning zero economic profit. C) incurring a loss, but the loss is smaller than the firm's total fixed cost. D) earning positive economic profit.

View Answer
divider
BEST MATCH

Solve, please. Thank you! Drag and drop the appropriate terms to complete the reactions of the proton-proton chain. 1H + 1H → 2H + Ve 1H + 2H → 3He + Y 3He + 3He → 4He + X 1H 1H 2H 3H e 3He 4He

View Answer
divider
BEST MATCH

Question 12 Three resistances R1, R2, and R3 are connected to a battery as shown in the figure. Given: R1 = 8?, R2 = 4?, R3 = 6?, Find the ratio of the potential difference between the points A and B, and potential difference between B and C, i.e. $V_{AB}/V_{BC}$

View Answer
divider