The results of a research study on the growth rate of car sales in 2000-2022 in one country have the results as below. The
statistical significance level is set at 0.05.
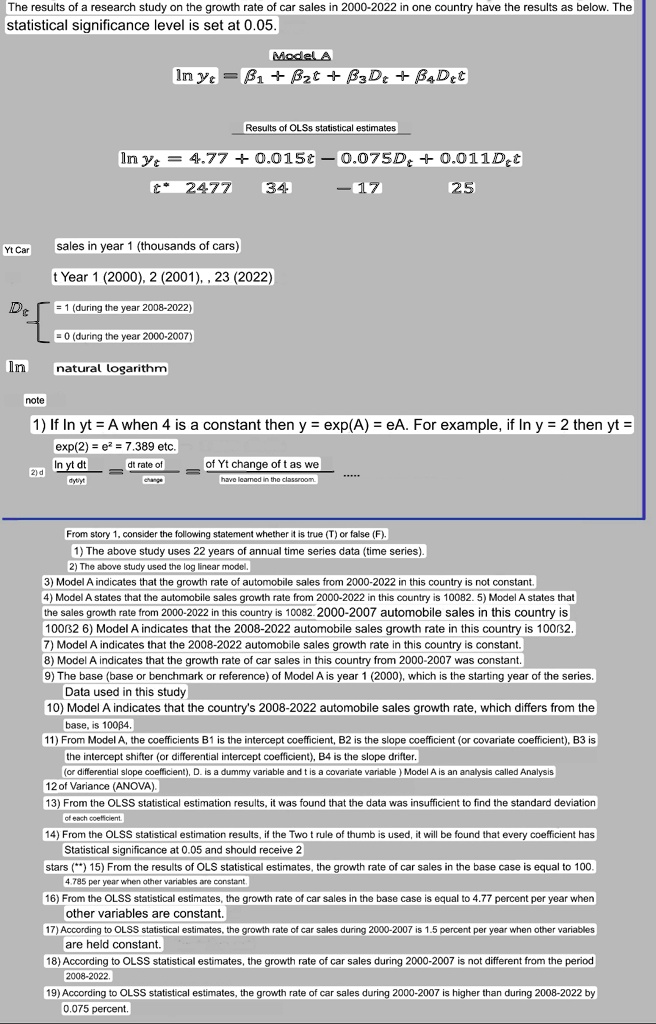
Model A
In ye=B1+B2t + B3D + BADet
Results of OLSs statistical estimates
In y = 4.77 +0.015t-0.075D + 0.011 Det
t* 2477
34
Yt Car
sales in year 1 (thousands of cars)
t Year 1 (2000), 2 (2001),, 23 (2022)
De
= 1 (during the year 2008-2022)
= 0 (during the year 2000-2007)
Im
natural logarithm
note
-17
25
1) If In yt = A when 4 is a constant then y = exp(A) = eA. For example, if In y = 2 then yt =
exp(2) = e² = 7.389 etc.
In yt dt
dt rate of
of Yt change of t as we
2) d
=
dytlyt
change
have learned in the classroom.
From story 1, consider the following statement whether it is true (T) or false (F).
1) The above study uses 22 years of annual time series data (time series).
2) The above study used the log linear model.
3) Model A indicates that the growth rate of automobile sales from 2000-2022 in this country is not constant.
4) Model A states that the automobile sales growth rate from 2000-2022 in this country is 10082. 5) Model A states that
the sales growth rate from 2000-2022 in this country is 10082. 2000-2007 automobile sales in this country is
10032 6) Model A indicates that the 2008-2022 automobile sales growth rate in this country is 10032.
7) Model A indicates that the 2008-2022 automobile sales growth rate in this country is constant.
8) Model A indicates that the growth rate of car sales in this country from 2000-2007 was constant.
9) The base (base or benchmark or reference) of Model A is year 1 (2000), which is the starting year of the series.
Data used in this study
10) Model A indicates that the country's 2008-2022 automobile sales growth rate, which differs from the
base, is 100ẞ4.
11) From Model A, the coefficients B1 is the intercept coefficient, B2 is the slope coefficient (or covariate coefficient), B3 is
the intercept shifter (or differential intercept coefficient), B4 is the slope drifter.
(or differential slope coefficient), D. is a dummy variable and t is a covariate variable) Model A is an analysis called Analysis
12 of Variance (ANOVA).
13) From the OLSS statistical estimation results, it was found that the data was insufficient to find the standard deviation
of each coefficient.
14) From the OLSS statistical estimation results, if the Two t rule of thumb is used, it will be found that every coefficient has
Statistical significance at 0.05 and should receive 2
stars (**) 15) From the results of OLS statistical estimates, the growth rate of car sales in the base case is equal to 100.
4.785 per year when other variables are constant.
16) From the OLSS statistical estimates, the growth rate of car sales in the base case is equal to 4.77 percent per year when
other variables are constant.
17) According to OLSS statistical estimates, the growth rate of car sales during 2000-2007 is 1.5 percent per year when other variables
are held constant.
18) According to OLSS statistical estimates, the growth rate of car sales during 2000-2007 is not different from the period
2008-2022.
19) According to OLSS statistical estimates, the growth rate of car sales during 2000-2007 is higher than during 2008-2022 by
0.075 percent.