Question 2
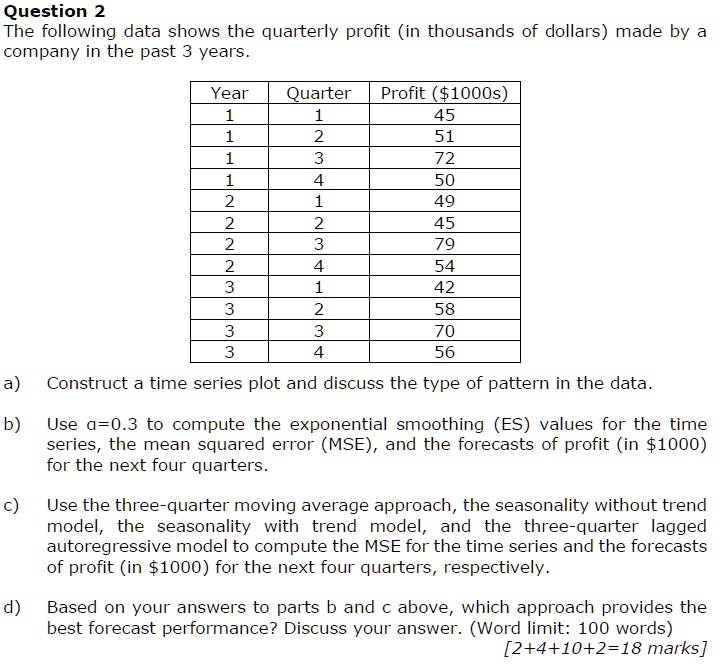
The following data shows the quarterly profit (in thousands of dollars) made by a
company in the past 3 years.
Year Quarter Profit ($1000s)
1 1 45
1 2 51
1 3 72
1 4 50
2 1 49
2 2 45
2 3 79
2 4 54
3 1 42
3 2 58
3 3 70
3 4 56
a) Construct a time series plot and discuss the type of pattern in the data.
b) Use $\alpha$=0.3 to compute the exponential smoothing (ES) values for the time
series, the mean squared error (MSE), and the forecasts of profit (in $1000)
for the next four quarters.
c) Use the three-quarter moving average approach, the seasonality without trend
model, the seasonality with trend model, and the three-quarter lagged
autoregressive model to compute the MSE for the time series and the forecasts
of profit (in $1000) for the next four quarters, respectively.
d) Based on your answers to parts b and c above, which approach provides the
best forecast performance? Discuss your answer. (Word limit: 100 words)
[2+4+10+2=18 marks]