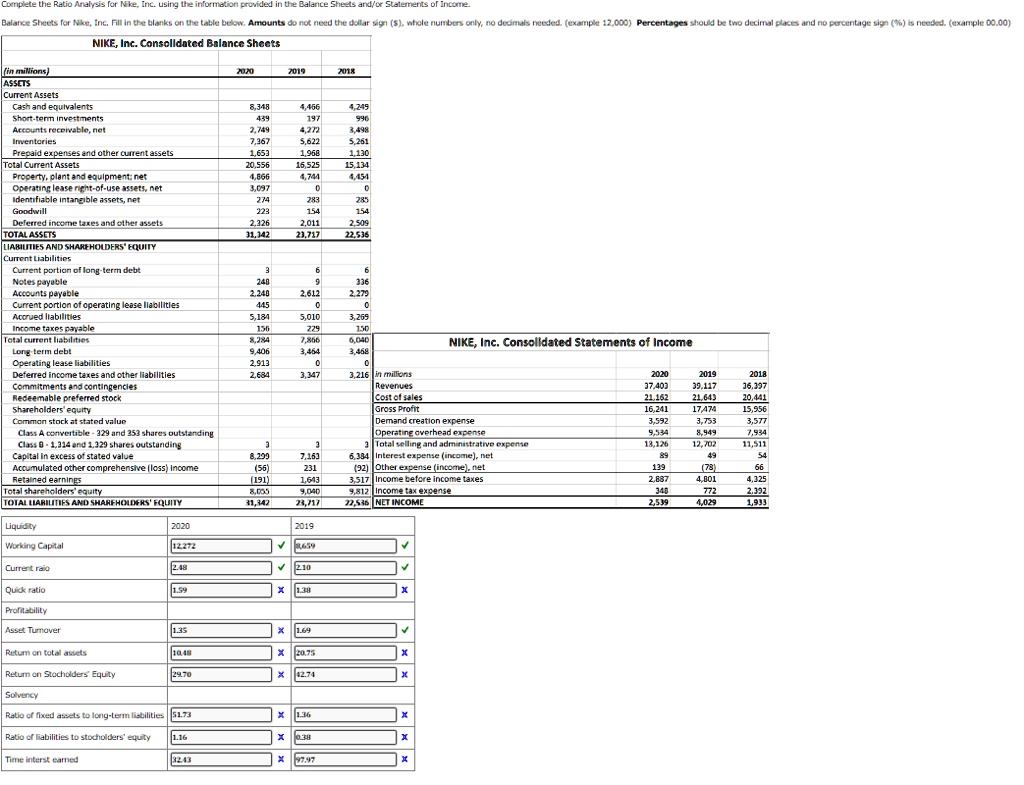
Complete the Ratio Analysis for Nike, Inc. using the information provided in the Balance Sheets and/or Statements of Income.
Balance Sheets for Nike, Inc. Fill in the blanks on the table below. Amounts do not need the dollar sign ($), whole numbers only, no decimals needed. (example 12,000) Percentages should be two decimal places and no percentage sign (%) is needed. (example 00.00)
NIKE, Inc. Consolidated Balance Sheets
(in millions)
2020
2019
2018
ASSETS
Current Assets
Cash and equivalents
8,348
4,466
4,245
Short-term investments
439
197
996
Accounts receivable, net
2,749
4,272
3,498
Inventories
7,367
5,622
5,261
Prepaid expenses and other current assets
1,653
1,968
1,130
Total Current Assets
20,556
16,525
15,134
Property, plant and equipment, net
4,866
4,744
4,454
Operating lease right-of-use assets, net
3,097
0
0
Identifiable intangible assets, net
274
283
285
Goodwill
223
154
154
Deferred income taxes and other assets
2,226
2,011
2,509
TOTAL ASSETS
31,342
23,717
22,536
LIABILITIES AND SHAREHOLDERS' EQUITY
Current Liabilities
Current portion of long-term debt
3
6
6
Notes payable
240
9
336
Accounts payable
2,240
2,612
2,279
Current portion of operating lease liabilities
445
0
0
Accrued liabilities
5,184
5,010
3,299
Income taxes payable
156
229
130
Total current liabilities
8,284
7,866
6,040
Long-term debt
9,406
3,464
3,468
Operating lease liabilities
2,913
0
0
Deferred income taxes and other liabilities
2,684
3,347
3,216
Commitments and contingencies
Redeemable preferred stock
Shareholders' equity
Common stock at stated value
Class A convertible - 329 and 353 shares outstanding
Class B - 1,314 and 1,329 shares outstanding
3
3
3
Capital in excess of stated value
8,209
7,163
6,384
Accumulated other comprehensive (loss) income
(56)
231
(92)
Retained earnings
(191)
1,643
3,517
Total shareholders' equity
8,005
9,040
9,812
TOTAL LIABILITIES AND SHAREHOLDERS' EQUITY
31,342
23,717
22,536
NIKE, Inc. Consolidated Statements of Income
in millions
2020
2019
2018
Revenues
37,403
39,117
36,397
Cost of sales
21,162
21,643
20,441
Gross Profit
16,241
17,474
15,956
Demand creation expense
3,592
3,753
3,577
Operating overhead expense
9,534
8,949
7,934
Total selling and administrative expense
13,126
12,702
11,511
Interest expense (income), net
89
49
54
Other expense (income), net
139
(78)
66
Income before income taxes
2,887
4,801
4,325
Income tax expense
348
772
2,392
NET INCOME
2,539
4,029
1,933
Liquidity
2020
2019
Working Capital
12,272
8,659
Current ratio
2.48
2.10
Quick ratio
1.59
1.38
Profitability
Asset Turnover
1.35
1.69
Return on total assets
10.48
20.75
Return on Stockholders' Equity
29.70
42.74
Solvency
Ratio of fixed assets to long-term liabilities
51.73
1.36
Ratio of liabilities to stockholders' equity
1.16
0.38
Time interest earned
32.43
97.97