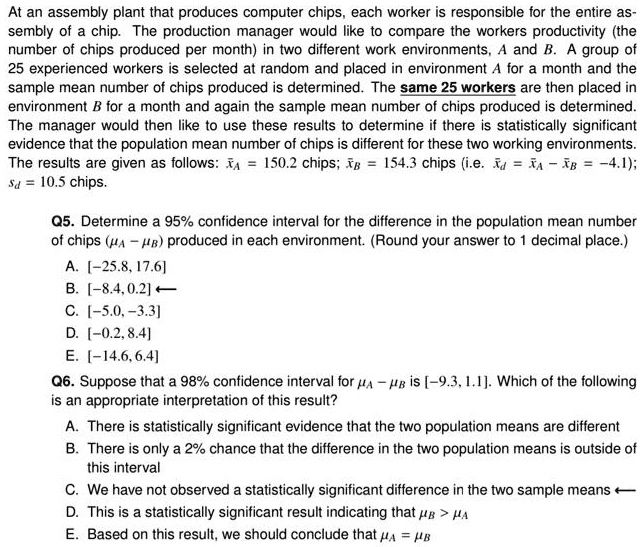
At an assembly plant that produces computer chips, each worker is responsible for the entire as-
sembly of a chip. The production manager would like to compare the workers productivity (the
number of chips produced per month) in two different work environments, A and B. A group of
25 experienced workers is selected at random and placed in environment A for a month and the
sample mean number of chips produced is determined. The same 25 workers are then placed in
environment B for a month and again the sample mean number of chips produced is determined.
The manager would then like to use these results to determine if there is statistically significant
evidence that the population mean number of chips is different for these two working environments.
The results are given as follows: $\bar{x}_A$ = 150.2 chips; $\bar{x}_B$ = 154.3 chips (i.e. $\bar{x}_d$ = $\bar{x}_A$ - $\bar{x}_B$ = -4.1);
$s_d$ = 10.5 chips.
Q5. Determine a 95% confidence interval for the difference in the population mean number
of chips ($\mu_A$ - $\mu_B$) produced in each environment. (Round your answer to 1 decimal place.)
A. [-25.8, 17.6]
B. [-8.4, 0.2]
C. [-5.0, -3.3]
D. [-0.2, 8.4]
E. [-14.6, 6.4]
Q6. Suppose that a 98% confidence interval for $\mu_A$ - $\mu_B$ is [-9.3, 1.1]. Which of the following
is an appropriate interpretation of this result?
A. There is statistically significant evidence that the two population means are different
B. There is only a 2% chance that the difference in the two population means is outside of
this interval
C. We have not observed a statistically significant difference in the two sample means
D. This is a statistically significant result indicating that $\mu_B$ > $\mu_A$
E. Based on this result, we should conclude that $\mu_A$ = $\mu_B$