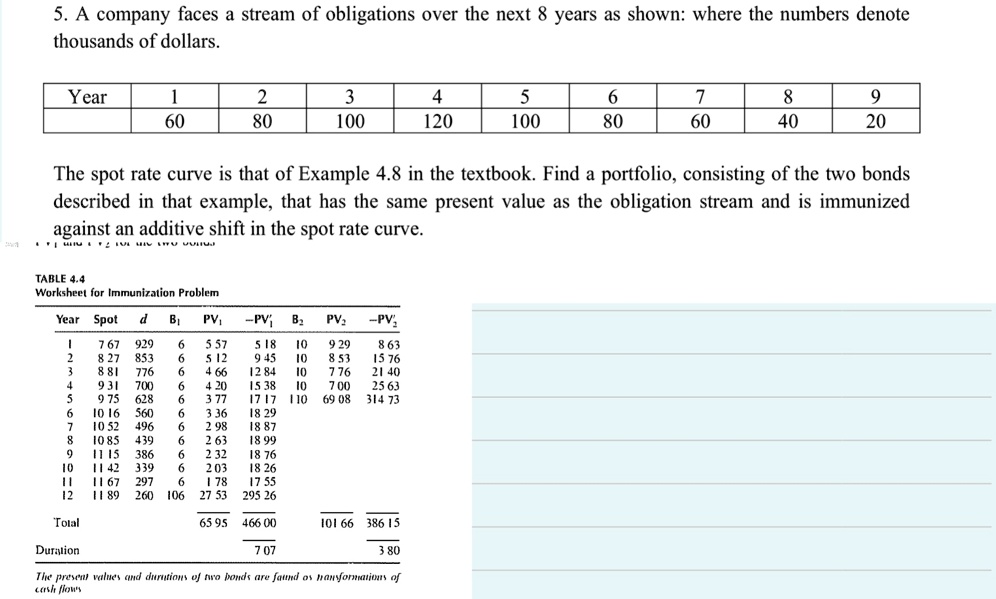
A company faces a stream of obligations over the next 8 years as shown: where the numbers denote thousands of dollars.
able[[Year,1,2,3,4,5,6,7,8,9],[,60,80,100,120,100,80,60,40,20]]
The spot rate curve is that of Example 4.8 in the textbook. Find a portfolio, consisting of the two bonds described in that example, that has the same present value as the obligation stream and is immunized against an additive shift in the spot rate curve.
TABLE 4.4 Worksheet for Immunization Problem
able[[Year,Spot,d,B_(1),PV_(1),-PV_(1)^('),B_(2),PV_(2),-PV_(2)^(')
5. A company faces a stream of obligations over the next 8 years as shown: where the numbers denote thousands of dollars
Year
1 60
2 80
3 100
4 120
5 100
6 80
7 60
8 40
9 20
The spot rate curve is that of Example 4.8 in the textbook. Find a portfolio, consisting of the two bonds described in that example, that has the same present value as the obligation stream and is immunized against an additive shift in the spot rate curve.
TABLE 4.4 Worksheet for Immunization Problem
Year Spot d
B1 PV; PV B PV2 PV 7 67 929 6 5 57 518 10 9 29 2 8 27 853 6 5 12 9 45 10 8 53 15 76 188 776 6 4 66 12 84 10 7 76 21 40 4 9 31 700 6 4 20 15 38 10 700 25 63 5 9 75 628 6 3 77 1717 110 69 08 314 73 6 1016 560 6 3 36 18 29 7 10 52 496 6 2 98 18 87 8 1085 439 6 2 63 18 99 9 1115 386 6 2 32 18 76 10 11 42 339 6 203 18 26 1167 297 6 178 17 55 12 1189 260 106 27 53 295 26
65 95 466 00
10166 386 15
Duration
707
380
The present values and duration of two bonds are found as a summary of cash flows.