4.
DETAILS
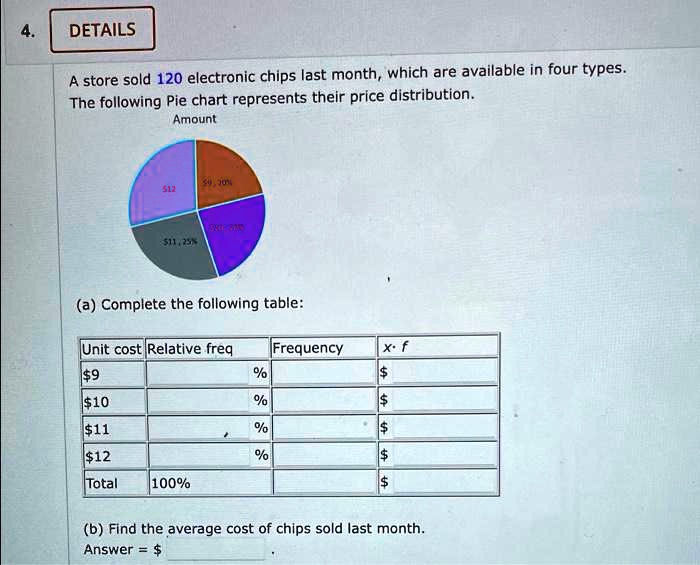
A store sold 120 electronic chips last month, which are available in four types.
The following Pie chart represents their price distribution.
Amount
59,20%
512
511,25%
(a) Complete the following table:
Unit cost Relative freq
Frequency
x - f
$9
%
$
$10
%
$
$11
%
$
$12
%
$
Total 100%
$
(b) Find the average cost of chips sold last month.
Answer = $