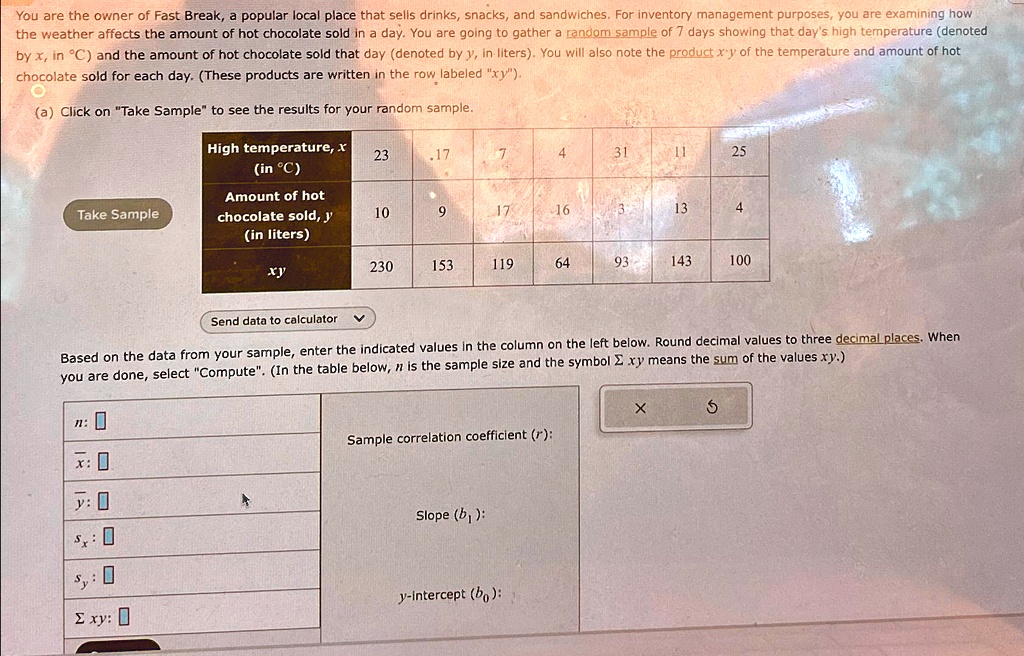
You are the owner of Fast Break, a popular local place that sells drinks, snacks, and sandwiches. For inventory management purposes, you are examining how the weather affects the amount of hot chocolate sold in a day. You are going to gather a random sample of 7 days showing that day's high temperature (denoted by x, in °C) and the amount of hot chocolate sold that day (denoted by y, in liters). You will also note the product x*y of the temperature and amount of hot chocolate sold for each day. (These products are written in the row labeled "xy").
(a) Click on "Take Sample" to see the results for your random sample.
High temperature, (in °C)
23
17
7
4
31
11
25
Amount of hot chocolate sold, y (in liters)
10
9
17
16
13
23
153
119
64
93
143
100
xy
Send data to calculator
When you are done, select "Compute". (In the table below, n is the sample size and the symbol xy means the sum of the values xy.) X 5 Sample correlation coefficient (r):
y s
Slope (b)
y-intercept (bo)
xy