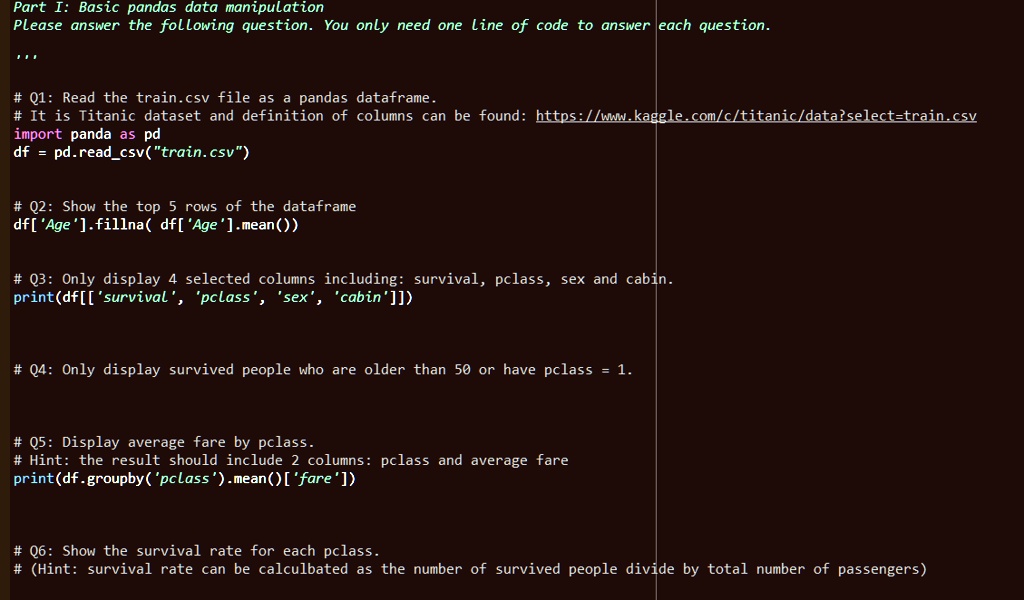
Part I: Basic pandas data manipulation
Please answer the following question. You only need one line of code to answer each question.
# Q1: Read the train.csv file as a pandas dataframe.
# It is Titanic dataset and definition of columns can be found: https://www.kaggle.com/c/titanic/data?select=train.csv
import panda as pd
df = pd.read_csv("train.csv")
# Q2: Show the top 5 rows of the dataframe
df['Age'].fillna(df['Age'].mean())
# Q3: Only display 4 selected columns including: survival, pclass, sex and cabin.
print(df[['survival', 'pclass', 'sex', 'cabin']])
# Q4: Only display survived people who are older than 50 or have pclass = 1.
# Q5: Display average fare by pclass.
# Hint: the result should include 2 columns: pclass and average fare
print(df.groupby('pclass').mean()['fare'])
# Q6: Show the survival rate for each pclass.
# (Hint: survival rate can be calculbated as the number of survived people divide by total number of passengers)