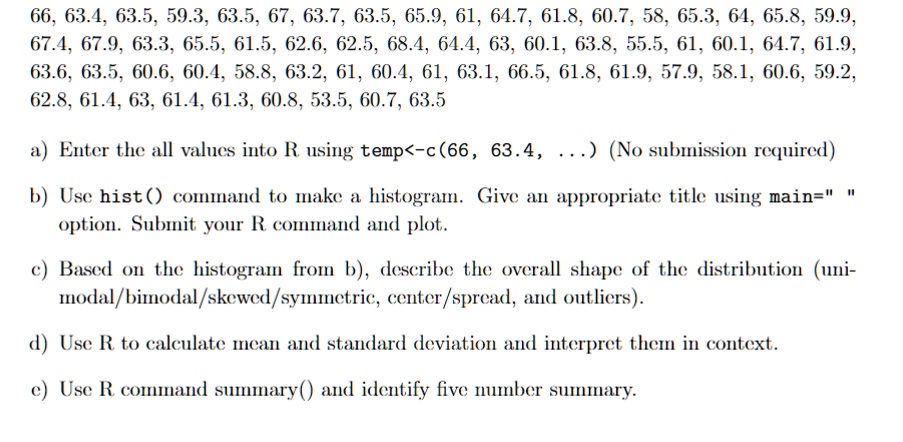
66, 63.4, 63.5, 59.3, 63.5, 67, 63.7, 63.5, 65.9, 61, 64.7, 61.8, 60.7, 58, 65.3, 64, 65.8, 59.9,
67.4, 67.9, 63.3, 65.5, 61.5, 62.6, 62.5, 68.4, 64.4, 63, 60.1, 63.8, 55.5, 61, 60.1, 64.7, 61.9,
63.6, 63.5, 60.6, 60.4, 58.8, 63.2, 61, 60.4, 61, 63.1, 66.5, 61.8, 61.9, 57.9, 58.1, 60.6, 59.2,
62.8, 61.4, 63, 61.4, 61.3, 60.8, 53.5, 60.7, 63.5
a) Enter the all values into R using \texttt{temp<-c(66, 63.4, ...)} (No submission required)
b) Use \texttt{hist()} command to make a histogram. Give an appropriate title using \texttt{main="}
option. Submit your R command and plot.
c) Based on the histogram from b), describe the overall shape of the distribution (uni-
modal/bimodal/skewed/symmetric, center/spread, and outliers).
d) Use R to calculate mean and standard deviation and interpret them in context.
e) Use R command \texttt{summary()} and identify five number summary.