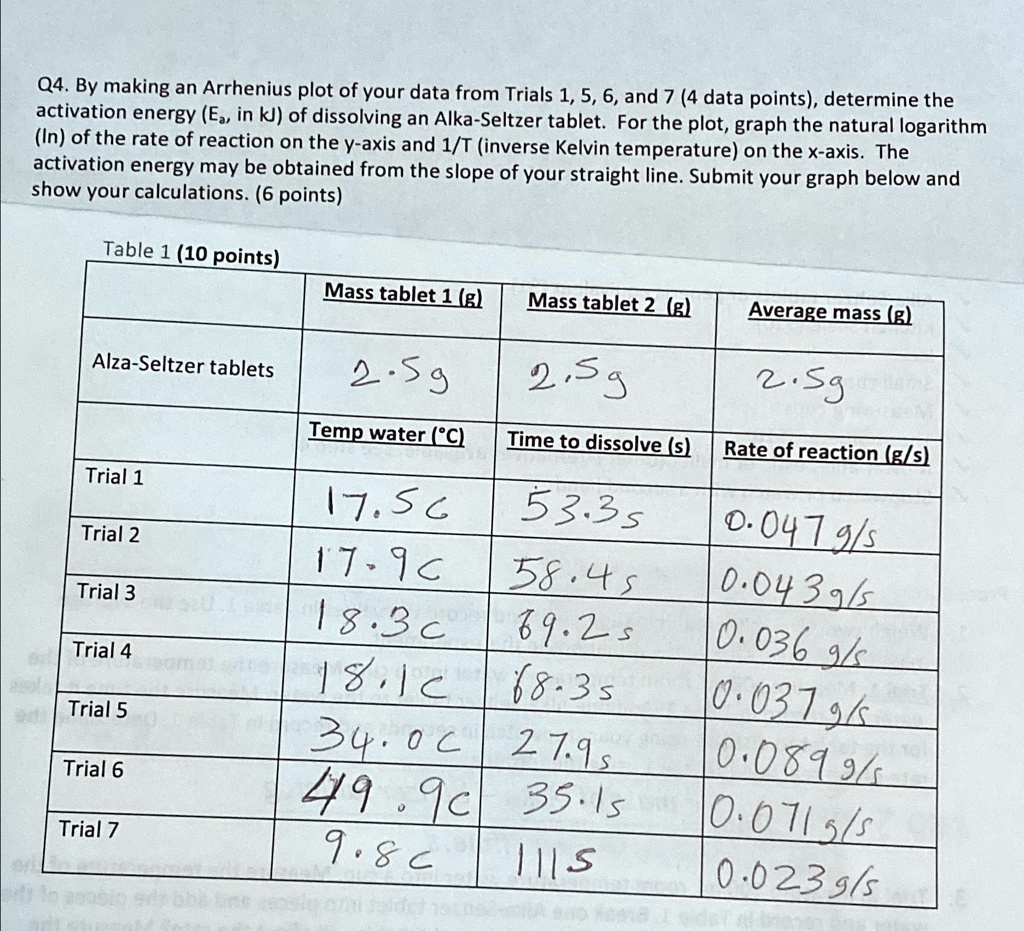
Q4. By making an Arrhenius plot of your data from Trials 1, 5, 6, and 7 (4 data points), determine the
activation energy ($E_a$, in kJ) of dissolving an Alka-Seltzer tablet. For the plot, graph the natural logarithm
(ln) of the rate of reaction on the y-axis and 1/T (inverse Kelvin temperature) on the x-axis. The
activation energy may be obtained from the slope of your straight line. Submit your graph below and
show your calculations. (6 points)
Table 1 (10 points)
Mass tablet 1 (g)
Mass tablet 2(g)
Average mass (g)
Alza-Seltzer tablets
2.5g
2.5g
2.5g
Temp water (°C)
Time to dissolve (s)
Rate of reaction (g/s)
Trial 1
17.5C
53.3s
0.047 g/s
Trial 2
17.9C
58.4s
0.043 g/s
Trial 3
18.3C
69.2s
0.036 g/s
Trial 4
18.1C
68.3s
0.037 g/s
Trial 5
34.0C
27.9s
0.089 g/s
Trial 6
49.9C
35.1s
0.071 g/s
Trial 7
9.8C
111s
0.023 g/s