The following is the output Mike obtained while conducting a regression analysis in Excel.
Table:
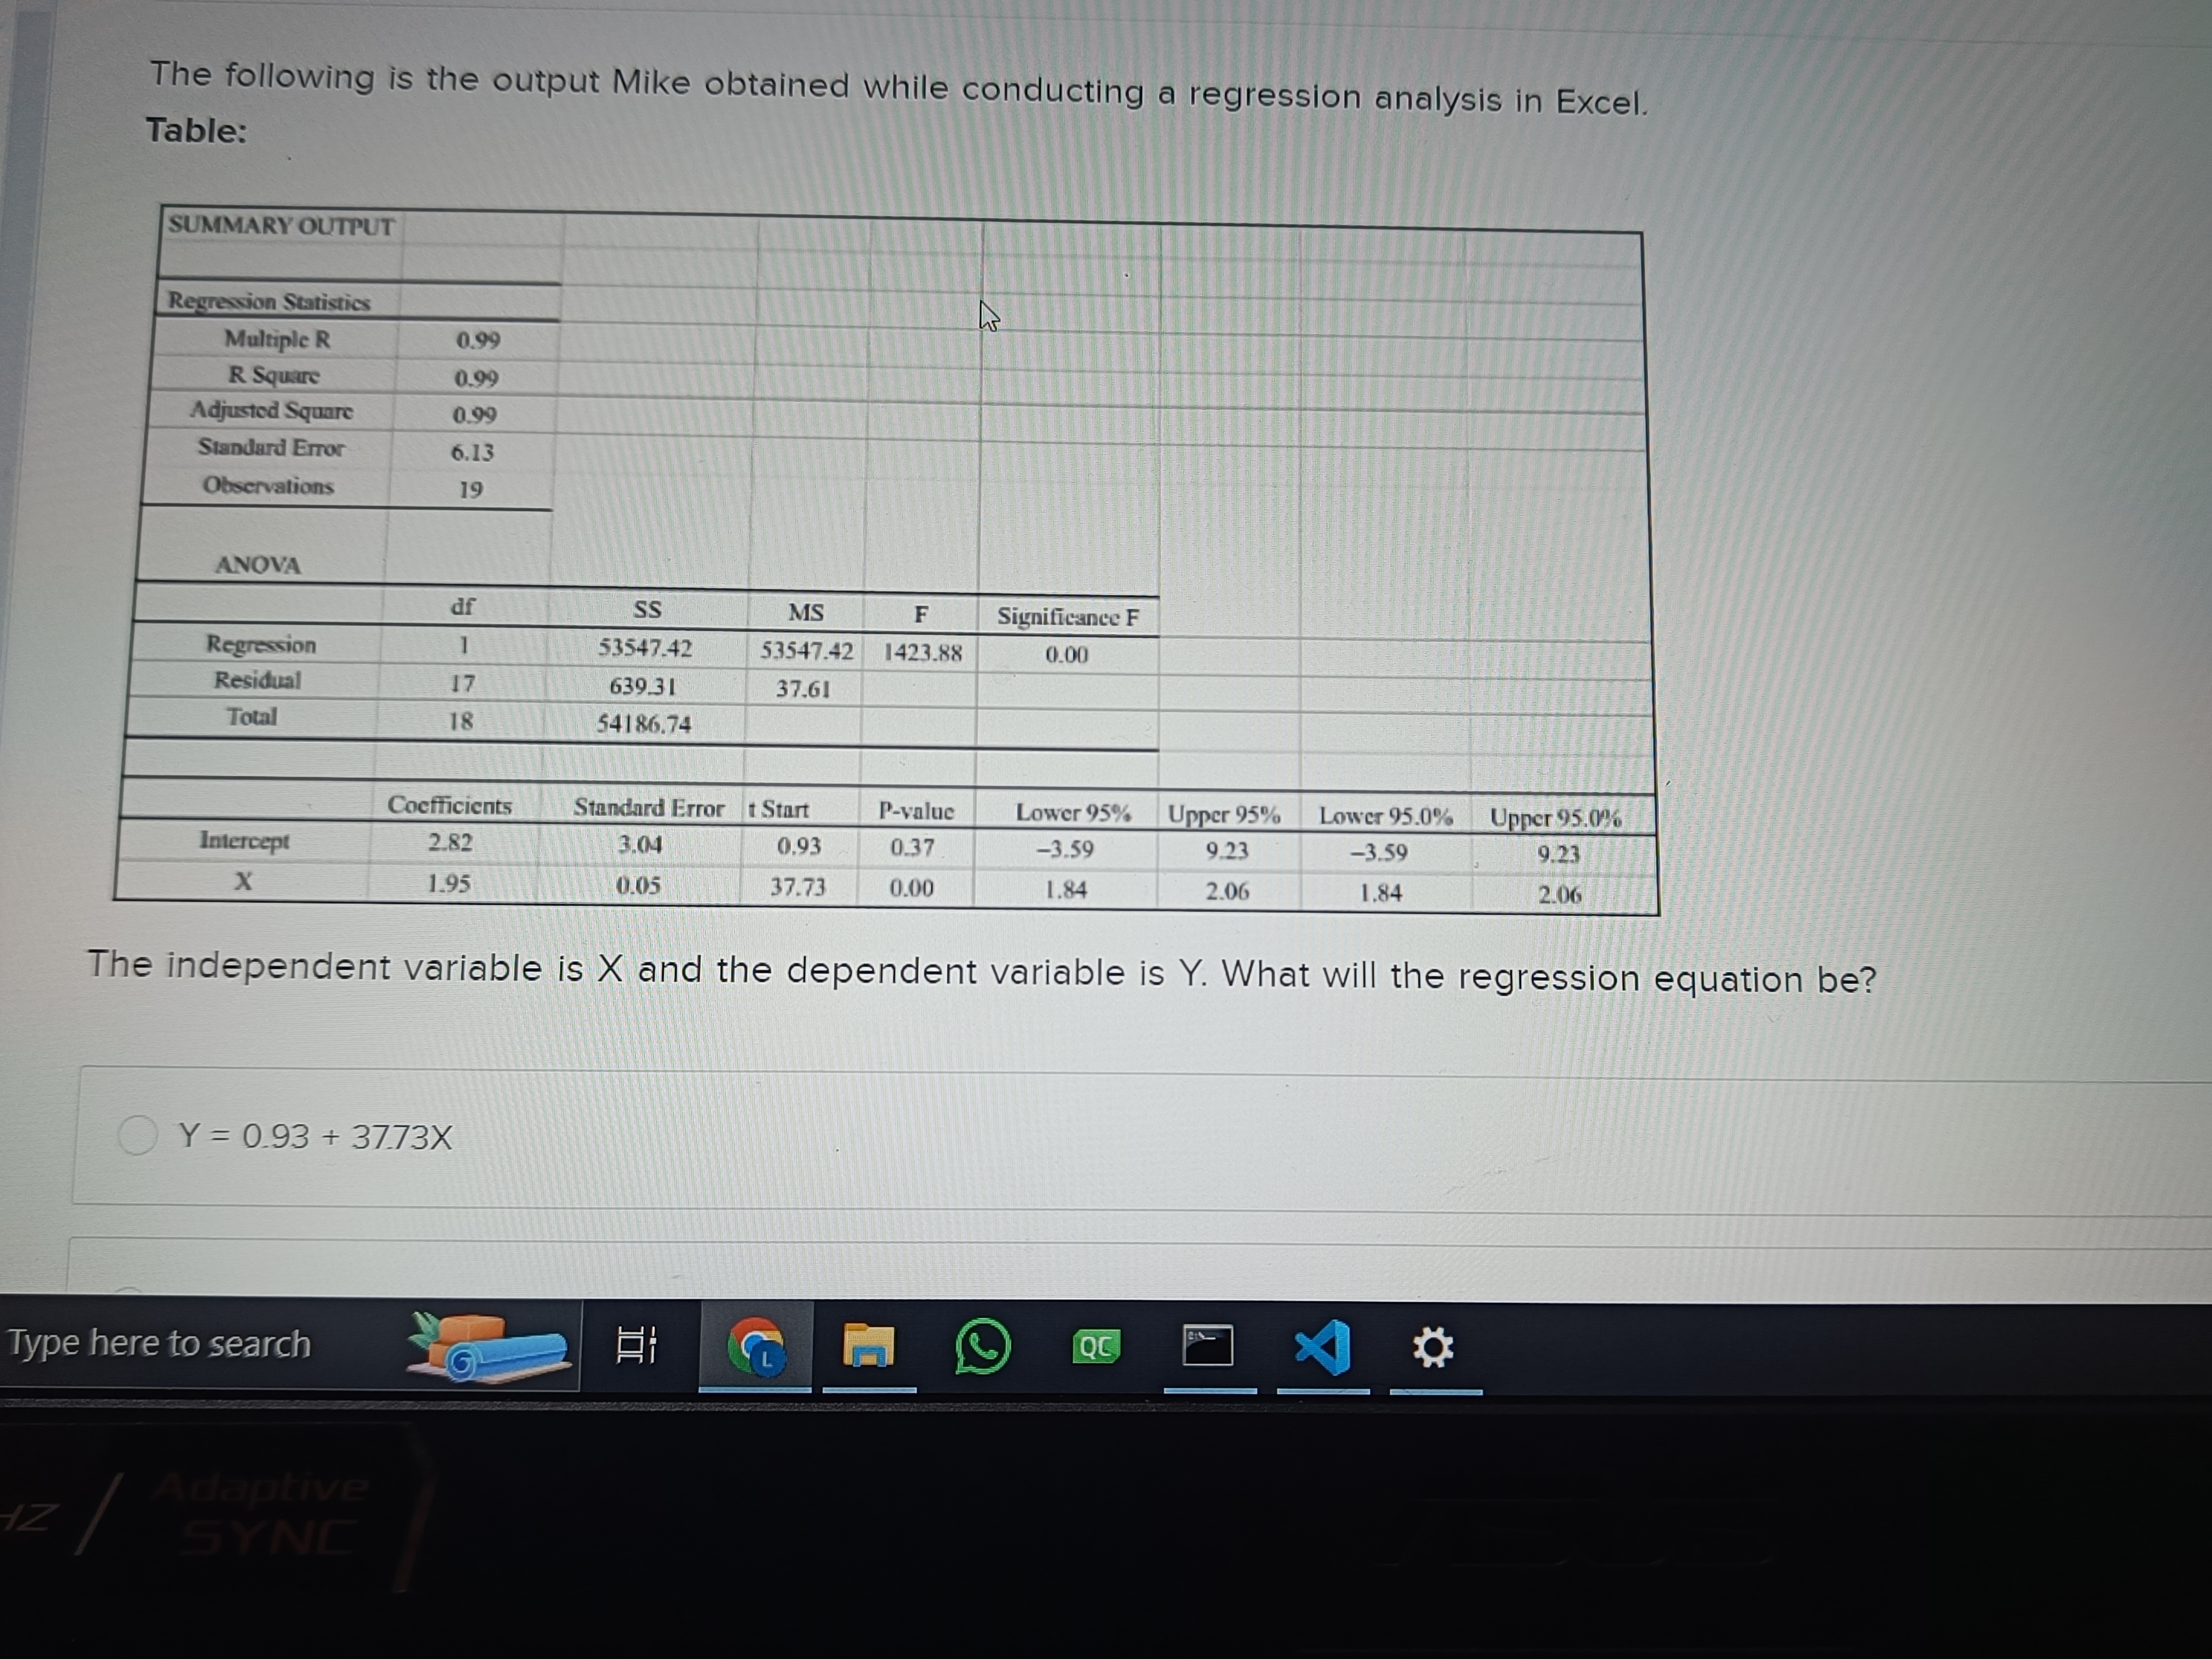
SUMMARY OUTPUT
Regression Statistics
Multiple R 0.99
R Square 0.99
Adjusted Square 0.99
Standard Error 6.13
Observations 19
ANOVA
df SS MS F Significance F
Regression 1 53547.42 53547.42 1423.88 0.00
Residual 17 639.31 37.61
Total 18 54186.74
Coefficients Standard Error t Stat P-value Lower 95% Upper 95% Lower 95.0% Upper 95.0%
Intercept 2.82 3.04 0.93 0.37 -3.59 9.23 -3.59 9.23
X 1.95 0.05 37.73 0.00 1.84 2.06 1.84 2.06
The independent variable is X and the dependent variable is Y. What will the regression equation be?
Y = 0.93 + 37.73X