information.
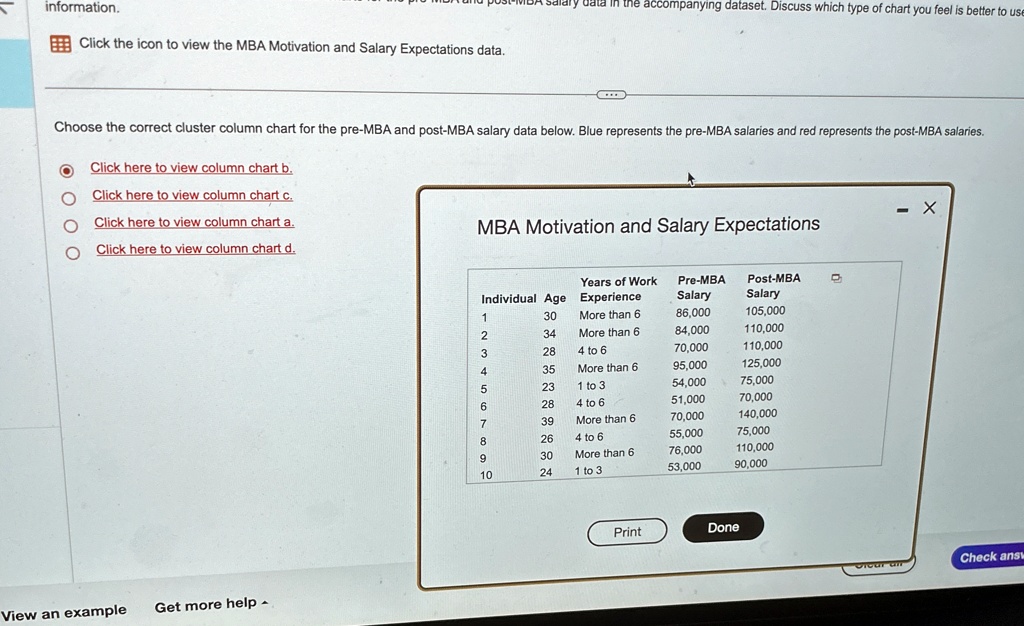
Click the icon to view the MBA Motivation and Salary Expectations data.
Choose the correct cluster column chart for the pre-MBA and post-MBA salary data below. Blue represents the pre-MBA salaries and red represents the post-MBA salaries.
Click here to view column chart b.
Click here to view column chart c.
Click here to view column chart a.
Click here to view column chart d.
MBA Motivation and Salary Expectations
Years of Work
Pre-MBA
Post-MBA
Individual Age Experience
Salary
Salary
1
30
More than 6
86,000
105,000
2
34
More than 6
84,000
110,000
3
28
4 to 6
70,000
110,000
4
35
More than 6
95,000
125,000
5
23
1 to 3
54,000
75,000
6
28
4 to 6
51,000
70,000
7
39
More than 6
70,000
140,000
8
26
4 to 6
55,000
75,000
9
30
More than 6
76,000
110,000
10
24
1 to 3
53,000
90,000
Print
Done
View an example
Get more help -
Check answ