Question 3
Question 4
Complete all parts (a), (b) and (c).
Complete part (a).
(a). A study in a Galway fast-food branch showed that out of a sample of 200 'single-item' orders
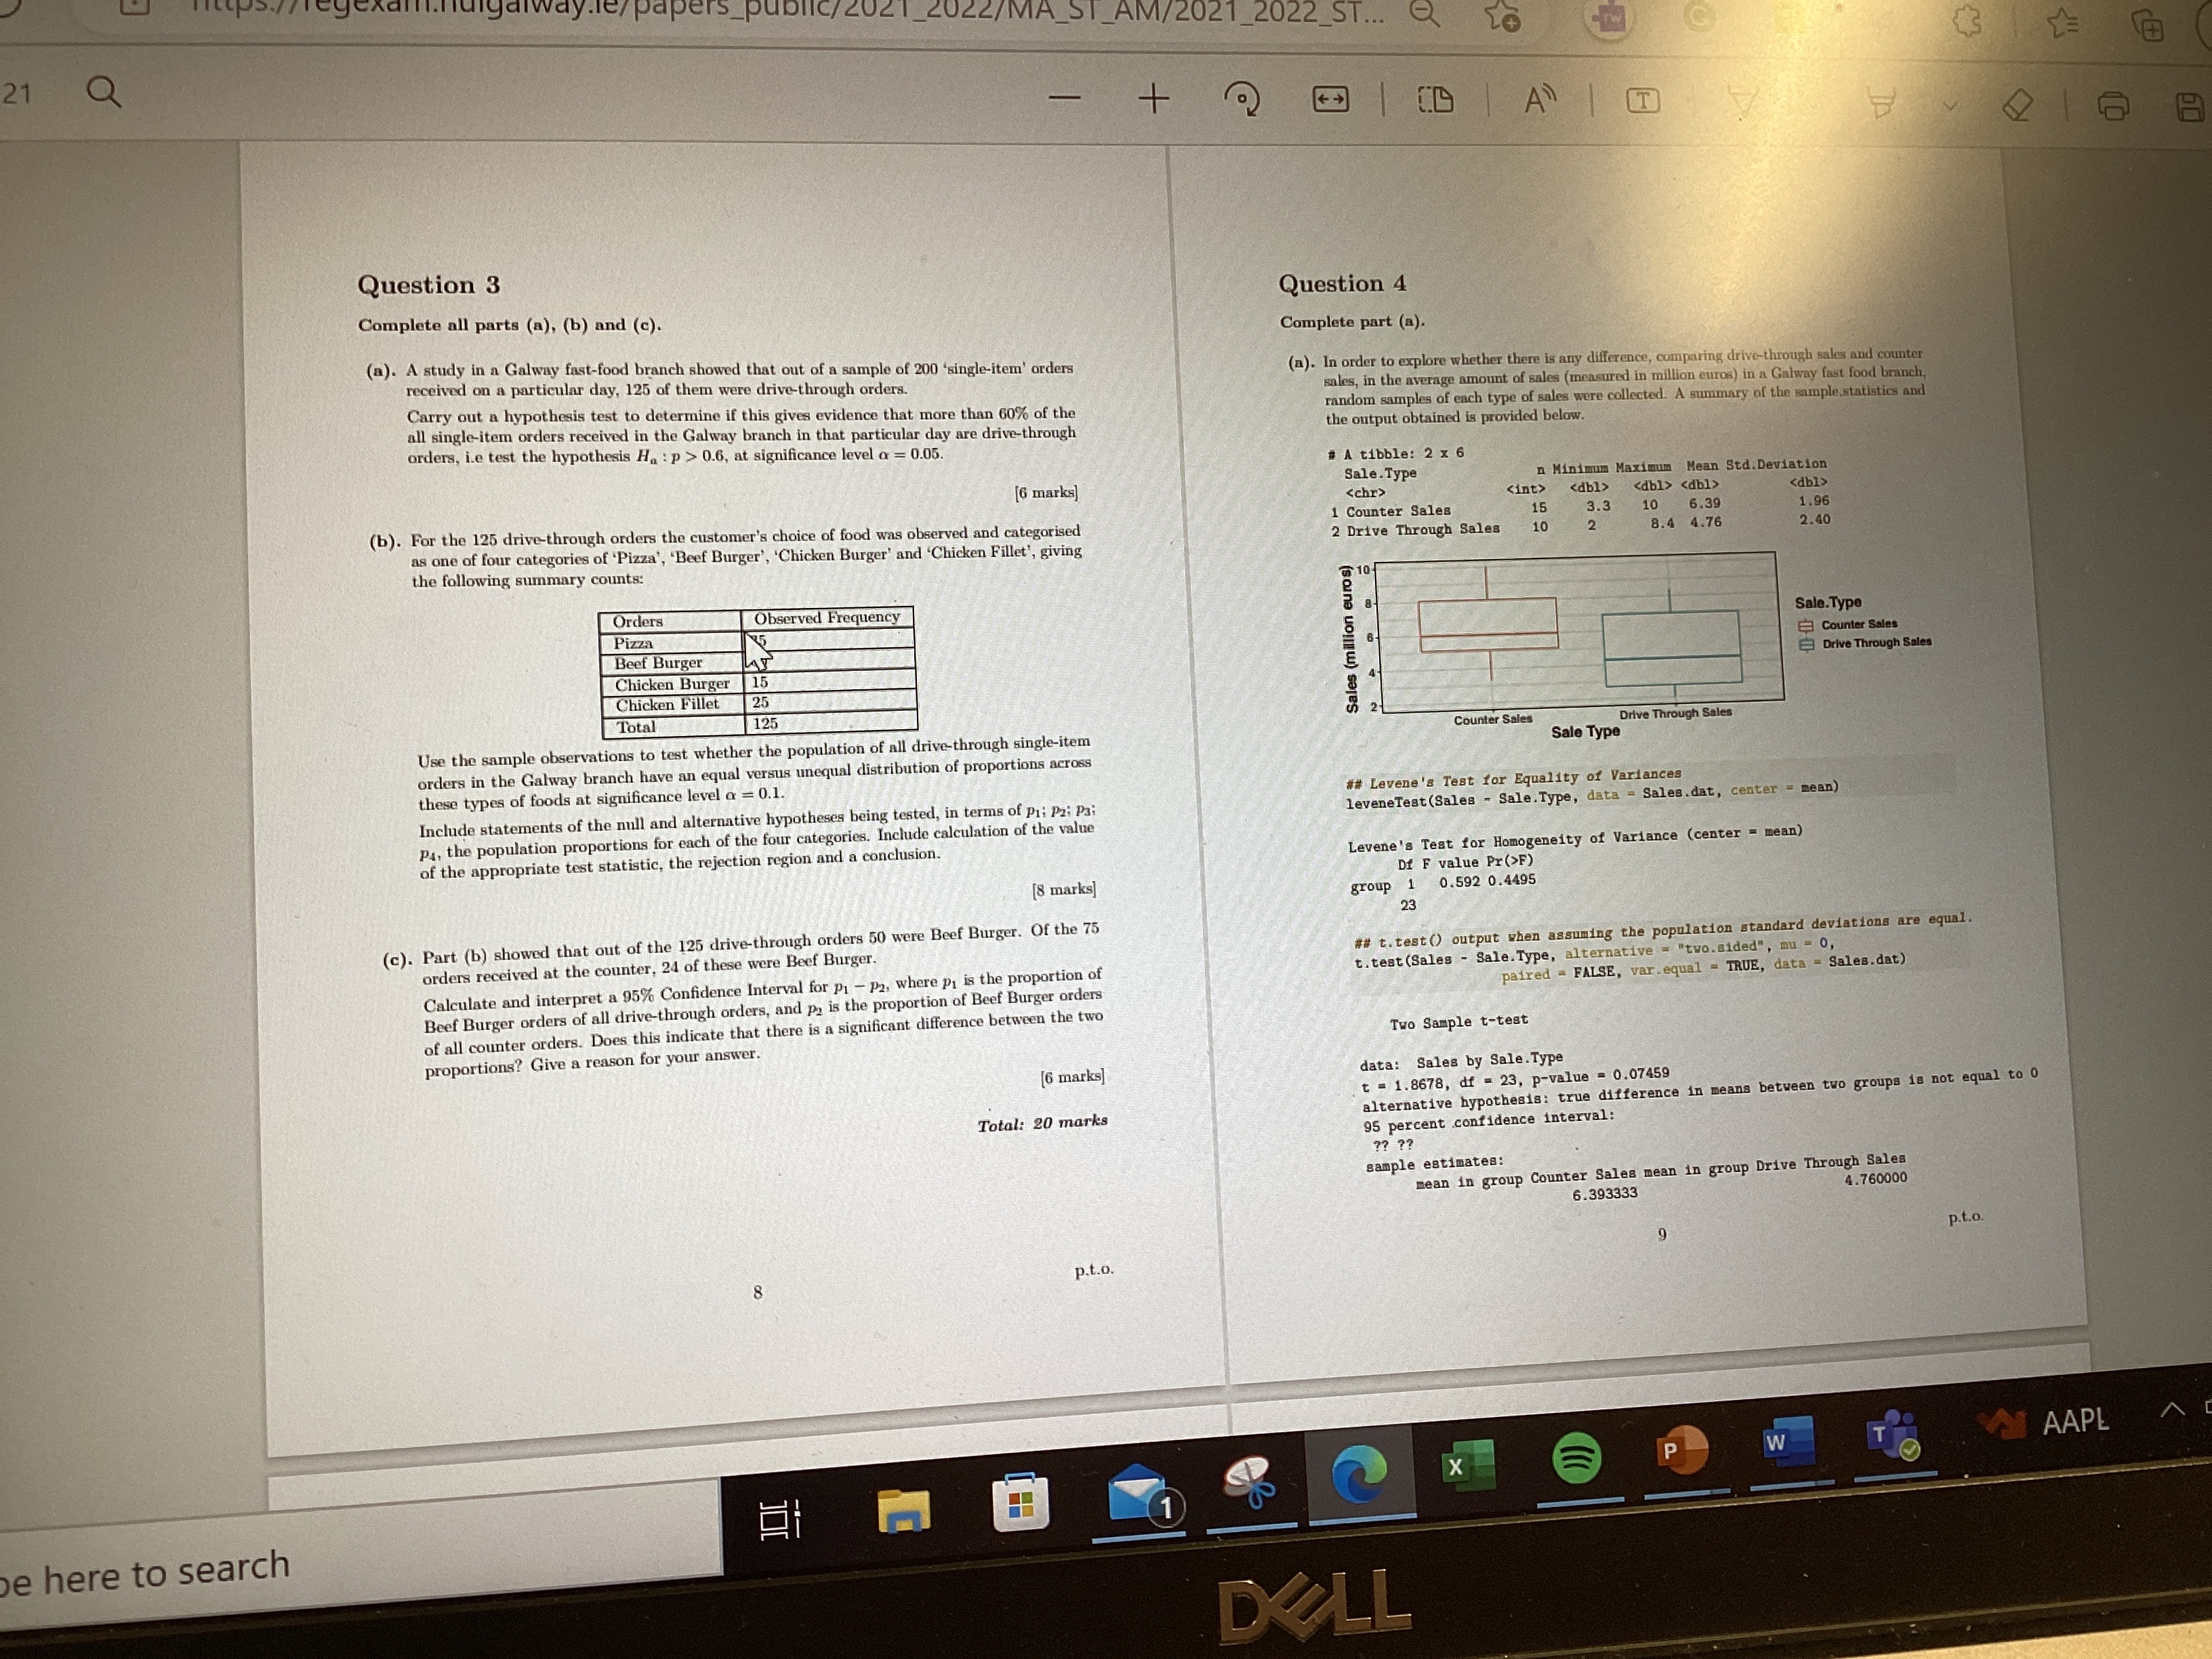
(a). In order to explore whether there is any difference, comparing drive-through sales and counter received on a particular day, 125 of them were drive-through orders. sales, in the average amount of sales (mensured in million euros) in a Galway fast food branch random samples of each type of sales were the output obtained is provided below.
Carry out a hypothesis test to determine if this gives evidence that more than \( 60 \% \) of the all single-item orders received in the Galway branch in that particular day are drive-through orders, i.e test the hypothesis \( H_{\mathbf{a}}: p>0.6 \), at significance level \( \alpha=0.05 \).
(b). For the 125 drive-through orders the customer's choice of food was observed and categorised as one of four categories of 'Pizza', 'Beef Burger', 'Chicken Burger' and 'Chicken Fillet', giving the following summary counts:
\begin{tabular}{|l|l|}
\hline Orders & Observed Frequency \\
\hline Pizza & 5 \\
\hline Beef Burger & 5 \\
\hline Chicken Burger & 15 \\
\hline Chicken Fillet & 25 \\
\hline Total & 125 \\
\hline
\end{tabular}
Use the sample observations to test whether the population of all drive-through single-item orders in the Galway branch have an equal versus unequal distribution of proportions across these types of foods at significance level \( \alpha=0 \).1.
Include statements of the null and alternative hypotheses being tested, in terms of \( p_{1} ; p_{2} ; p_{3} ; \) \( p_{4} \), the population proportions for each of the four categories. Include calculation of the value of the appropriate test statistic, the rejection region and a conclusion.
(c). Part (b) showed that out of the 125 drive-through orders 50 were Beef Burger. Of the 75 Di F value \( \mathrm{Pr}(>\mathrm{F}) \) orders received at the counter, 24 of these were Beef BurgerCalculate and interpret a \( 95 \% \) Confidence Interval for \( p_{1}-p_{2} \), where poef Burger orders of all counter orders. Does this indicate that proportions? Give a reason for your answer.
A\# t. test() output when assuming the population standard deviations are equal. t. test(Sales - Sale. Type, alternative = "two. a1ded", mu = 0 ,
pared = FALSE, var . equal = TRUE, data \( = \) Sales. dat)
Two Sample t-test
data: Sales by Sale.Type
\( t=1.8678, d f=23, p \)-value \( =0.07459 \)
alternative hypothesis: true difference in means between two groups ls not equal to 0 95 percent confidence interval:
sample estimates:
mean in group Counter Sales mean in group Drive Through Sales \( 6.393333 \)