Page
Calendar
utk.gricontent.com
Chapter 10: Lesson 1 Practice
Foundations of Percentages Practic
GroupMe
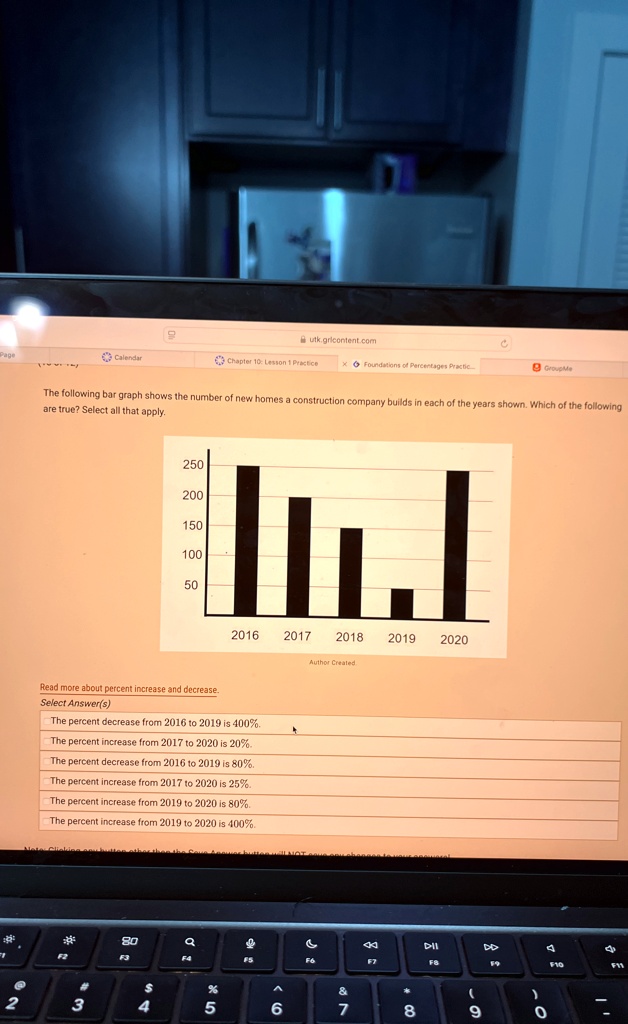
The following bar graph shows the number of new homes a construction company builds in each of the years shown. Which of the following
are true? Select all that apply.
250
200
150
100
50
2016
2017
2018
2019
2020
Author Created
Read more about percent increase and decrease.
Select Answer(s)
The percent decrease from 2016 to 2019 is 400%.
The percent increase from 2017 to 2020 is 20%.
The percent decrease from 2016 to 2019 is 80%.
The percent increase from 2017 to 2020 is 25%.
The percent increase from 2019 to 2020 is 80%.
The percent increase from 2019 to 2020 is 400%.