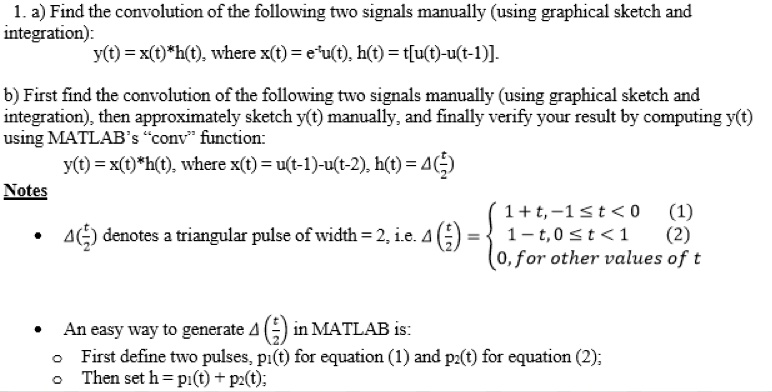
1. a) Find the convolution of the following two signals manually (using graphical sketch and
integration):
y(t) = x(t)*h(t), where x(t) = e<sup>t</sup>u(t), h(t) = t[u(t)-u(t-1)].
b) First find the convolution of the following two signals manually (using graphical sketch and
integration), then approximately sketch y(t) manually, and finally verify your result by computing y(t)
using MATLAB's \"conv\" function:
y(t) = x(t)*h(t), where x(t) = u(t-1)-u(t-2), h(t) = \Delta(\frac{t}{2})
Notes
$\Delta(\frac{t}{2})$ denotes a triangular pulse of width = 2, i.e. $\Delta(\frac{t}{2}) = \begin{cases} 1+t, & -1 \le t < 0 & (1) \\ 1-t, & 0 \le t < 1 & (2) \\ 0, & \text{for other values of t} \end{cases}$
An easy way to generate $\Delta(\frac{t}{2})$ in MATLAB is:
First define two pulses, p<sub>1</sub>(t) for equation (1) and p<sub>2</sub>(t) for equation (2);
Then set h = p<sub>1</sub>(t) + p<sub>2</sub>(t);