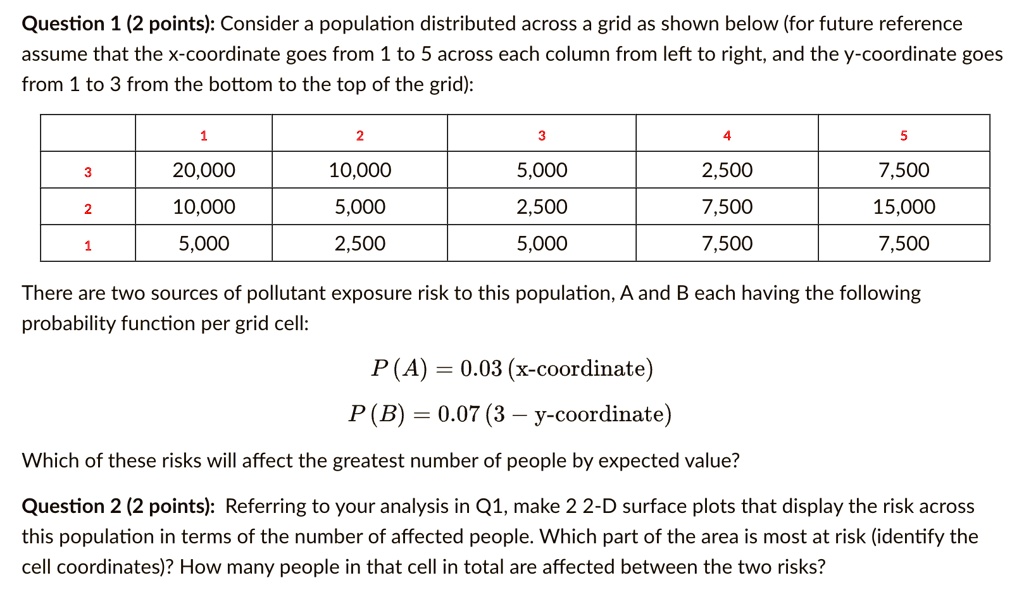
Question 1 (2 points): Consider a population distributed across a grid as shown below (for future reference
assume that the x-coordinate goes from 1 to 5 across each column from left to right, and the y-coordinate goes
from 1 to 3 from the bottom to the top of the grid):
1
2
3
4
5
3
20,000
10,000
5,000
2,500
7,500
2
10,000
5,000
2,500
7,500
15,000
1
5,000
2,500
5,000
7,500
7,500
There are two sources of pollutant exposure risk to this population, A and B each having the following
probability function per grid cell:
P(A) = 0.03 (x-coordinate)
P(B) = 0.07 (3 - y-coordinate)
Which of these risks will affect the greatest number of people by expected value?
Question 2 (2 points): Referring to your analysis in Q1, make 2 2-D surface plots that display the risk across
this population in terms of the number of affected people. Which part of the area is most at risk (identify the
cell coordinates)? How many people in that cell in total are affected between the two risks?