Ohm's Law Graphing Lab
Name:
Period:
Date:
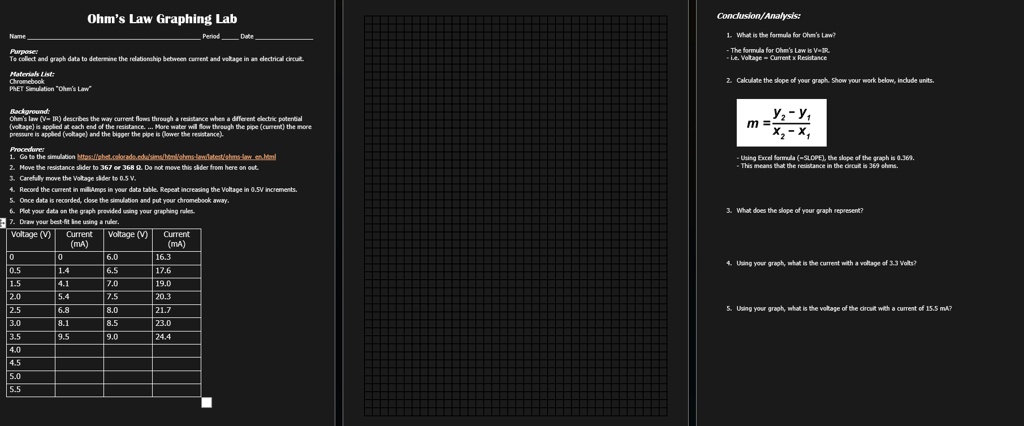
Purpose:
To collect and graph data to determine the relationship between current and voltage in an electrical circuit.
Materials List:
Chromebook
PhET Simulation "Ohm's Law"
Background:
Ohm's law (V = IR) describes the way current flows through a resistance when a different electric potential (voltage) is applied at each end of the resistance... More water will flow through the pipe (current) the more pressure is applied (voltage) and the bigger the pipe is (lower the resistance).
Procedure:
1. Go to the simulation https://phet.colorado.edu/sims/html/ohms-law/latest/ohms-law_en.html
2. Move the resistance slider to 367 or 368 Ω. Do not move this slider from here on out.
3. Carefully move the Voltage slider to 0.5 V.
4. Record the current in milliAmps in your data table. Repeat increasing the Voltage in 0.5V increments.
5. Once data is recorded, close the simulation and put your chromebook away.
6. Plot your data on the graph provided using your graphing rules.
7. Draw your best-fit line using a ruler.
Voltage (V) Current (mA) Voltage (V) Current (mA)
0 0 6.0 16.3
0.5 1.4 6.5 17.6
1.5 4.1 7.0 19.0
2.0 5.4 7.5 20.3
2.5 6.8 8.0 21.7
3.0 8.1 8.5 23.0
3.5 9.5 9.0 24.4
4.0
4.5
5.0
5.5
Conclusion/Analysis:
1. What is the formula for Ohm's Law?
- The formula for Ohm's Law is V=IR.
- i.e. Voltage = Current x Resistance
2. Calculate the slope of your graph. Show your work below, include units.
$$m = \frac{y_2 - y_1}{x_2 - x_1}$$
- Using Excel formula (-SLOPE), the slope of the graph is 0.369.
- This means that the resistance in the circuit is 369 ohms.
3. What does the slope of your graph represent?
4. Using your graph, what is the current with a voltage of 3.3 Volts?
5. Using your graph, what is the voltage of the circuit with a current of 15.5 mA?